
Table 1
Means, Standard Deviations, and Correlations between Variables (Study 1).
| M | SD | 2. | 3. | 4. | 5. | 6. | |
|---|---|---|---|---|---|---|---|
| 1. Positive interdependence | 4.87 | 1.25 | – | 0.50** | – | 0.40** | – |
| 0.46** | 0.48** | 0.50** | |||||
| 2. Negative interdependence | 3.03 | 1.51 | – | 0.67** | – | 0.70** | |
| 0.44** | 0.53** | ||||||
| 3. Group-based gratitude | 4.71 | 1.29 | – | 0.48** | – | ||
| 0.50** | 0.50** | ||||||
| 4. Prejudice | 2.92 | 1.09 | – | 0.76** | |||
| 0.54** | |||||||
| 5. Facilitating behaviors | 5.06 | 1.22 | – | ||||
| 0.63** | |||||||
| 6. Harmful behaviors | 2.59 | 1.39 |
[i] Note. ** p ≤ 0.001.
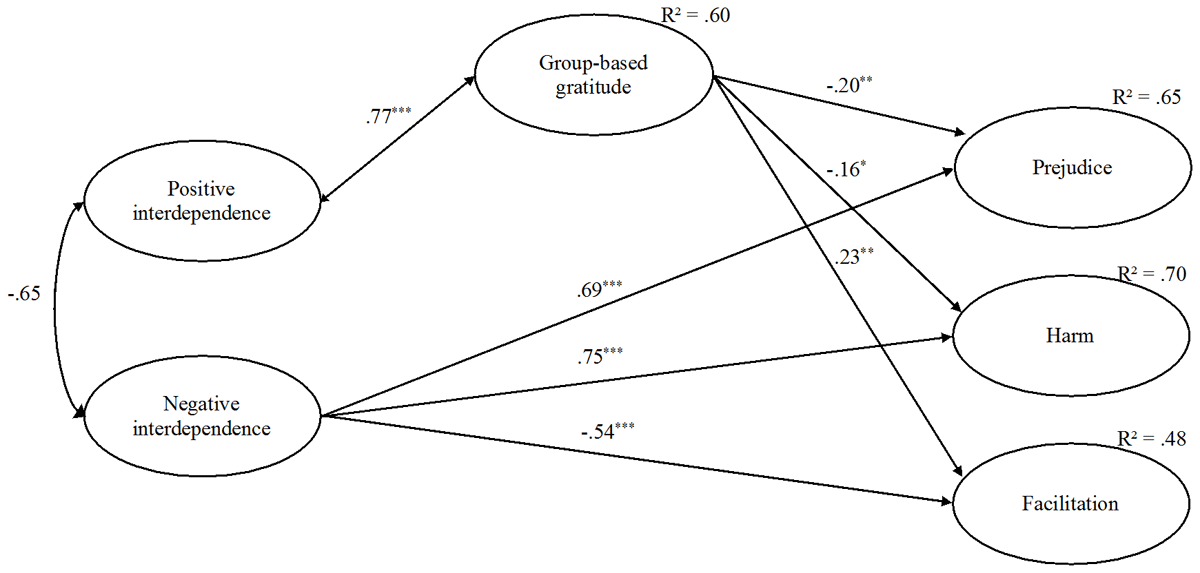
Figure 1
Models linking positive and negative interdependence to prejudice and facilitating and harmful behavioral tendencies via group-based gratitude (Study 1).
Note: *** p ≤ 0.001; ** p < 0.01; * p < 0.05.
Table 2
Fit indices between competing models (Study 1).
| Model | SRMR | GFI | CFI | TLI | NFI | RMSEA | PCLOSE | AIC | χ2 | df | χ2/df | |
|---|---|---|---|---|---|---|---|---|---|---|---|---|
| Hypothesized models | ||||||||||||
| Interdependence → Gratitude → DVs Full mediation | 0.056 | 0.894 | 0.950 | 0.938 | 0.908 | 0.068 | [0.056–0.080] | 0.007 | 348.001 | 254.001 | 124 | 2.048 |
| Interdependence → Gratitude → DVs Partial mediation | 0.055 | 0.894 | 0.949 | 0.935 | 0.908 | 0.070 | [0.058–0.082] | 0.004 | 353.712 | 253.712 | 121 | 2.097 |
| Alternative models (full mediation) | ||||||||||||
| Interdependence → DVs → Gratitude | 0.063 | 0.880 | 0.935 | 0.919 | 0.895 | 0.078 | [0.067–0.090] | 0.000 | 387.977 | 289.977 | 122 | 2.377 |
| Gratitude → Interdependence → DVs | 0.144 | 0.879 | 0.928 | 0.911 | 0.887 | 0.082 | [0.070–0.093] | 0.000 | 404.638 | 310.638 | 124 | 2.505 |
[i] Note: Errors were allowed to correlate between our three dependent variables (DVs).
Table 3
Regression and mediation analysis including group-based gratitude as mediator, contribution of immigrants as independent variable and prejudice as dependent variable (Study 2).
| Group-based gratitude | Prejudice | |||||
|---|---|---|---|---|---|---|
| β | t | p | β | t | p | |
| Step 1 | ||||||
| C1: Contributions vs. Control | 0.33 | 3.76 | <0.001 | –0.18 | –2.04 | 0.04 |
| C2: Security vs. Economics & Culture | –0.08 | –0.963 | 0.34 | 0.08 | 0.882 | 0.38 |
| C3: Economics vs. Culture | 0.004 | 0.042 | 0.97 | –0.09 | –1.05 | 0.30 |
| R2 | 0.11 | 0.05 | ||||
| Step 2 | ||||||
| C1: Contributions vs. Control | –0.08 | –0.884 | 0.38 | |||
| C2: Security vs. Economics & Culture | 0.05 | 0.613 | 0.54 | |||
| C3: Economics vs. Culture | –0.09 | 1.08 | 0.28 | |||
| Group-based gratitude | –0.33 | –3.60 | <0.001 | |||
| R2 | 0.14 | |||||
Table 4
Regression analysis including group-based emotion induction, political orientation as independent variables and group-based emotions as dependent variable (Study 3).
| Gratitude | Admiration | |||||||||
|---|---|---|---|---|---|---|---|---|---|---|
| B | SE | t | p | 95% IC | B | SE | t | p | 95% IC | |
| Step 1 | ||||||||||
| C1: Gratitude vs. Other | 0.65 | 0.18 | 3.64 | <0.001 | [0.30, 0.99] | 0.57 | 0.17 | 3.32 | <0.001 | [0.23, 0.91] |
| C2: Positive vs. Control | 0.10 | 0.19 | 0.513 | 0.608 | [–0.27, 0.46] | 0.59 | 0.18 | 3.26 | <0.001 | [0.23, 0.94] |
| R2 | 0.036** | 0.057*** | ||||||||
| Step 2 | ||||||||||
| C1: Gratitude vs. Other | 0.59 | 0.18 | 3.34 | 0.001 | [0.24, 0.94] | 0.48 | 0.17 | 2.85 | <0.001 | [0.15, 0.81] |
| C2: Positive vs. Control | 0.12 | 0.18 | 0.65 | 0.518 | [–0.24, 0.48] | 0.63 | 0.17 | 3.60 | <0.001 | [0.29, 0.97] |
| Political Orientation | –0.11 | 0.04 | –2.85 | 0.005 | [–0.18, –0.03] | –0.18 | 0.04 | –5.16 | <0.001 | [–0.25, –0.11] |
| ΔR2 | 0.021** | 0.066*** | ||||||||
| Ingroup-condemnation | Outgroup-condemnation | |||||||||
| B | SE | t | p | 95% IC | B | SE | t | p | 95% IC | |
| Step 1 | ||||||||||
| C1: Gratitude vs. Other | 0.43 | 0.18 | 2.42 | 0.016 | [0.08, 0.78] | –0.05 | 0.16 | –.315 | 0.753 | [–0.36, 0.26] |
| C2: Positive vs. Control | –0.55 | 0.19 | –2.98 | 0.003 | [–0.91, –0.19] | –0.52 | 0.16 | –3.21 | 0.001 | [–0.84, –0.20] |
| R2 | 0.040** | 0.028** | ||||||||
| Step 2 | ||||||||||
| C1: Gratitude vs. Other | 0.36 | 0.18 | 2.06 | 0.04 | [0.02, 0.71] | –0.01 | 0.16 | –0.057 | 0.955 | [–0.32, 0.30] |
| C2: Positive vs. Control | –0.52 | 0.18 | –2.86 | 0.004 | [–0.88, –0.16] | –0.54 | 0.16 | –3.326 | 0.001 | [–0.86, –0.22] |
| Political Orientation | –0.13 | 0.04 | –3.45 | <0.001 | [–0.19, –0.05] | 0.08 | 0.03 | 2.328 | 0.02 | [0.01, 0.14] |
| ΔR2 | 0.031*** | 0.015* | ||||||||
Table 5
Regression and mediation analysis including group-based emotion induction as independent variable and competence, warmth and dependence-oriented behaviors as dependent variable (Study 3).
| Competence | Warmth | Dependency-oriented Helping | |||||||||||||
|---|---|---|---|---|---|---|---|---|---|---|---|---|---|---|---|
| B | SE | t | p | 95% IC | B | SE | t | p | 95% IC | B | SE | t | p | 95% IC | |
| Step 1 | |||||||||||||||
| Gratitude vs. Other | 0.54 | 0.14 | 3.92 | <.001 | [0.27, 0.80,] | 0.56 | 0.15 | 30.90 | <0.001 | [0.28, 0.85] | 0.49 | 0.18 | 2.81 | .005 | [.15, .84] |
| Positive vs. Control | –0.09 | 0.14 | –0.64 | 0.53 | [–0.37, 0.19] | –0.11 | 0.15 | –0.75 | 0.455 | [–0.41, 0.18] | –0.25 | 0.18 | –1.35 | .179 | [–.61, .11] |
| R2 | 0.04*** | 0.04*** | 0.03** | ||||||||||||
| Step 2 | |||||||||||||||
| Gratitude vs. Other | 0.47 | 0.13 | 3.49 | 0.001 | [.20, .73] | 0.45 | 0.13 | 3.32 | 0.001 | [0.18, 0.71] | 0.34 | 0.16 | 2.12 | 0.034 | [0.03, 0.66] |
| Positive vs. Control | –0.06 | 0.14 | –.444 | 0.657 | [–.34, .21] | –0.06 | 0.14 | –0.45 | 0.653 | [–0.34, 0.21] | –0.18 | 0.17 | –1.09 | 0.276 | [–0.51, 0.15] |
| Political orientation | –0.13 | 0.03 | –4.62 | <0.001 | [–.18, –.07] | –0.22 | 0.03 | –7.96 | <0.001 | [–0.28, –0.17] | –0.29 | 0.03 | –8.46 | <0.001 | [–0.35, –0.22] |
| ΔR2 | 0.05*** | 0.15*** | 0.16*** | ||||||||||||
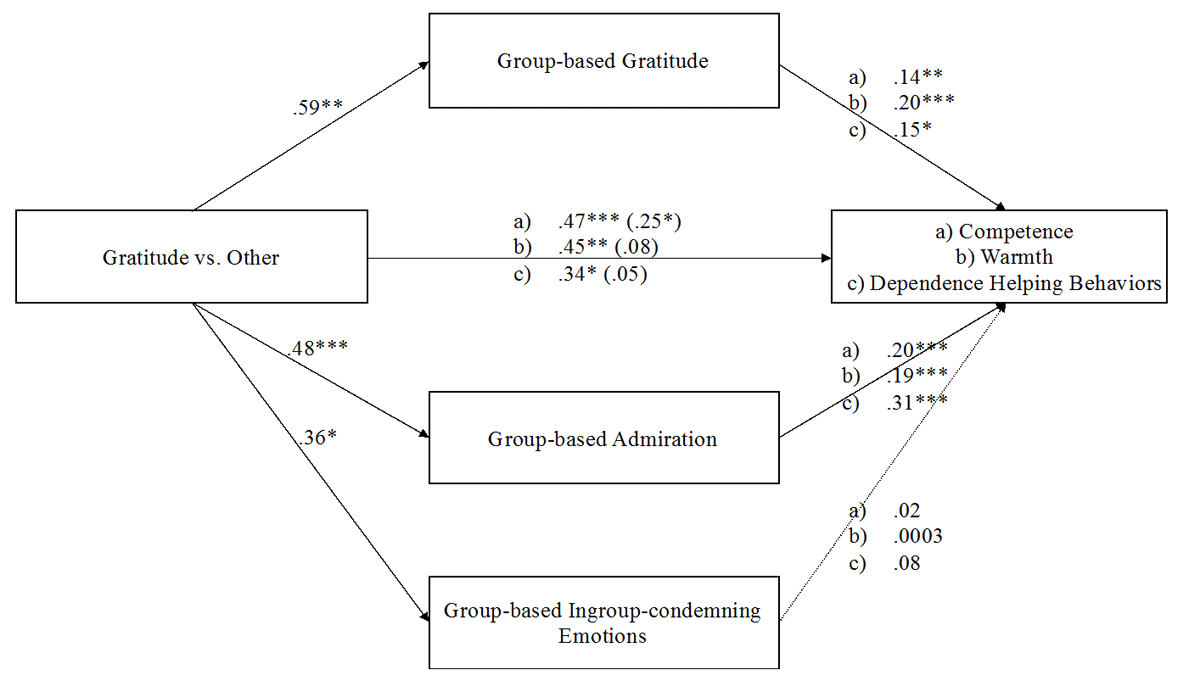
Figure 2
Mediation models of the influence of the emotion induction on competence, warmth, and dependency-oriented helping behaviors, via group-based emotions: gratitude, admiration and ingroup-condemning emotions. Effects are shown controlling for the contrast testing the residual variance and political orientation. Unstandardized coefficients are presented for each dependent variables referred as following a) competence, b) warmth, and c) dependence helping behaviors (Study 3).
Note: *** p ≤ 0.001; ** p < 0.01; * p < 0.05.