
Table 1
Specifications of existing solutions measuring peripheral temperature.
| Device | Wireless | Data saved on one’s own server only? | Recording frequency |
|---|---|---|---|
| Thermistors | No | Yes | Once per second |
| Thermocouples | No | Yes | Once per second |
| iButton | Yes | Yes | Once per minute |
| BlueMaestro Tempodisc | Yes | No | Once per second |
| ISP131001 sensor | Yes | Yes | Once per second |
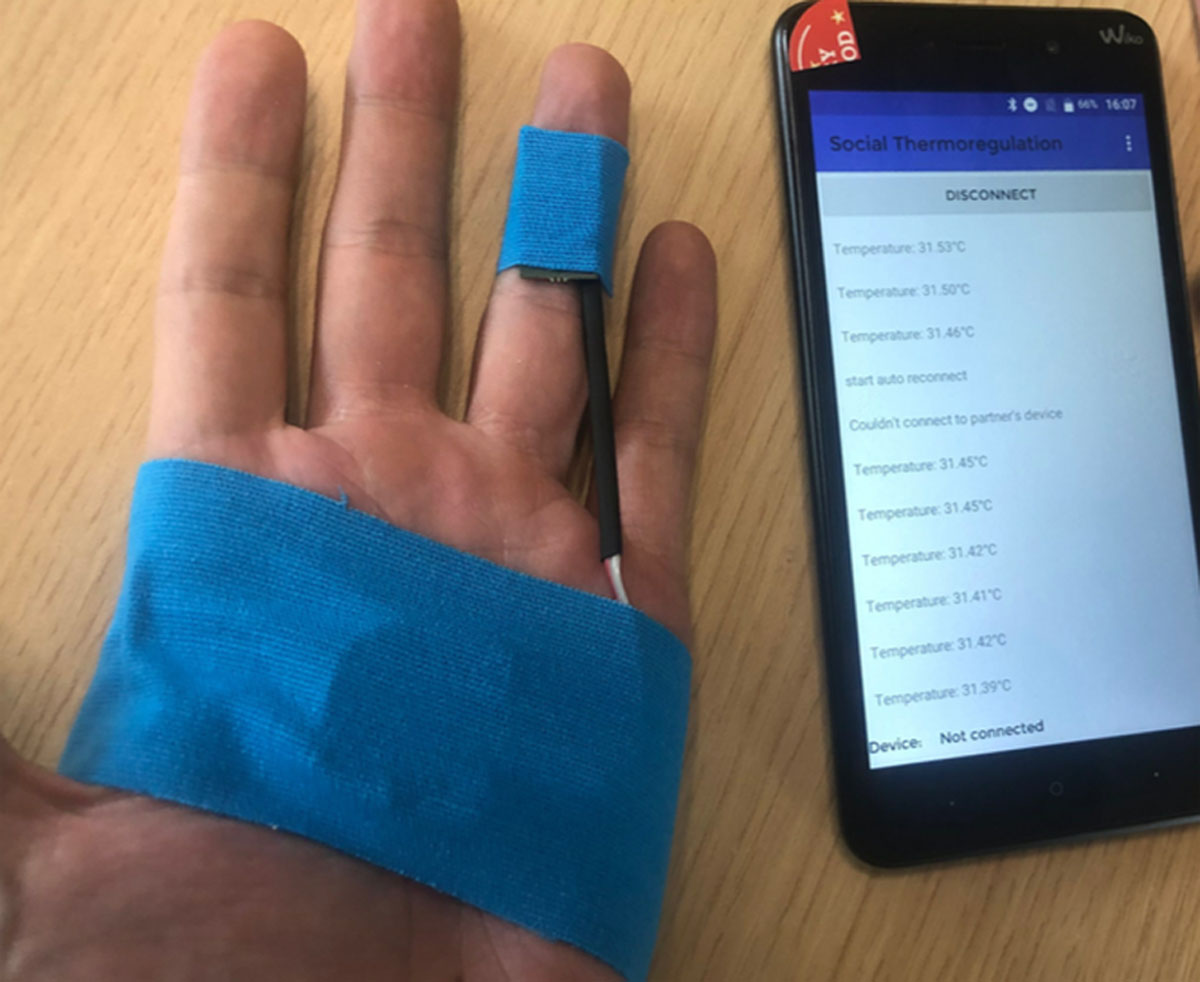
Figure 1
Sensor and Smartphone Application. Picture of the hand is one of the co-authors and thus posted with consent.
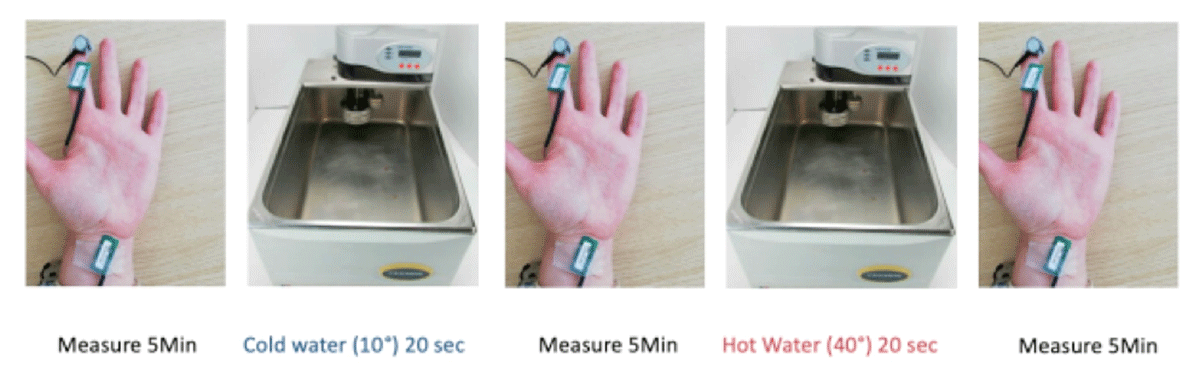
Figure 2
Schematic overview of position of our temperature measurements. Picture of the hand is one of the co-authors and thus posted with consent.
Table 2
Overview of our Analyses.
| Research Question | DV | IV | Random factors |
|---|---|---|---|
| 1. How correlated are the sensors overall, regardless of the position of the sensors or the temperature condition? | MLT probe | -ISP sensor (1 or 2 according to the analysis) -2 orthogonal contrasts for the temperature condition (C1: comparing cold and hot taken together to the baseline, and C2: comparing cold to hot) -centered variable for sensor positions - interaction terms | slope and intercept of participant number |
| 2. Are the sensors sufficiently correlated regardless of the position of the sensor? | MLT probe | -ISP sensor (1 or 2 according to the analysis) -2 orthogonal contrasts for the temperature condition -dummy coded variable for sensor positions - interaction terms | slope and intercept of participant number |
| 3. Are the sensors sufficiently correlated at different temperature levels? | MLT probe | -ISP sensor (1 or 2 according to the analysis) - dummy coded variable for the temperature condition -centered variable for sensor positions -interaction terms | slope and intercept of participant number |
Table 3
Standardized coefficients, p-values, and ηp2 for the analyses testing Research Question 1 (exploratory sample).
| Standardized coefficients (beta) | ηp2 | |
|---|---|---|
| MLT ~ ISP1 (overall) | 0.62*** | 0.30 |
| MLT ~ ISP 2 (overall) | 0.33*** | 0.13 |
[i] * Denotes p < 0.05, ** denotes p < 0.01, and *** denotes p < 0.001.
Table 4
Standardized coefficients, p-values, and ηp2 for the analyses testing Research Question 2 (exploratory sample).
| Standardized coefficients (beta) | ηp2 | |
|---|---|---|
| MLT ~ ISP1 (same position) | 0.62*** | 0.37 |
| MLT ~ ISP1 (different position) | 0.62*** | 0.10 |
| MLT ~ ISP 2 (same position) | 0.33*** | 0.25 |
| MLT ~ ISP 2 (different position) | 0.33*** | 0.01 |
[i] * Denotes p < 0.05, ** denotes p < 0.01, and *** denotes p < 0.001.
Table 5
Standardized coefficients, p-values and ηp2 for the analyses testing Research Question 3 (exploratory sample).
| Standardized coefficients (beta) | ηp2 | |
|---|---|---|
| MLT ~ ISP1 (baseline) | 0.93*** | 0.64 |
| MLT ~ ISP1 (hot) | 0.59*** | 0.30 |
| MLT ~ ISP1 (cold) | 0.59*** | 0.32 |
| MLT ~ ISP 2 (baseline) | 0.80*** | 0.60 |
| MLT ~ ISP 2(hot) | 0.34*** | 0.15 |
| MLT ~ ISP 2 (cold) | 0.32*** | 0.11 |
[i] * Denotes p < 0.05, ** denotes p < 0.01, and *** denotes p < 0.001.
Table 6
Standardized coefficients, p-values, and ηp2 for the correlation between the average of the two ISP sensors and the MLT probe (exploratory sample).
| Standardized coefficients (beta) | ηp2 | |
|---|---|---|
| MLT ~ ISP average (overall) | 0.71*** | 0.68 |
| MLT ~ ISP average (baseline) | 0.87*** | 0.84 |
| MLT ~ ISP average (hot) | 0.72* | 0.70 |
| MLT ~ ISP average (cold) | 0.72** | 0.75 |
[i] * Denotes p < 0.05, ** denotes p < 0.01, and *** denotes p < 0.001.
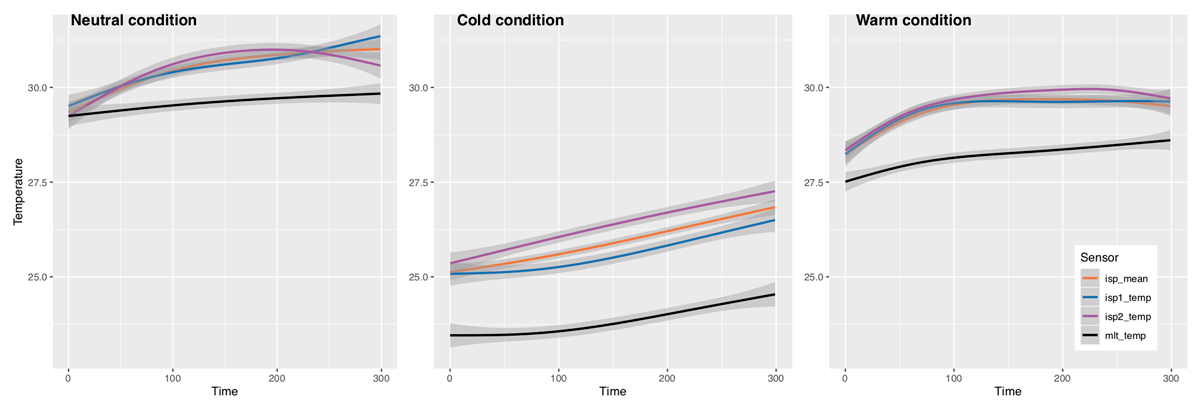
Figure 3
Visual representation of correlations between sensors in 3 experimental conditions (exploratory sample).
Table 8
Standardized coefficients, p-values, and ηp2 for the analyses testing Research Question 1, 2, 3 (confirmatory sample).
| Standardized coefficients (beta) | ηp2 | |
|---|---|---|
| MLT ~ ISP1 (overall) | 0.66*** | 0.48 |
| MLT ~ ISP1 (same position) | 0.66*** | 0.54 |
| MLT ~ ISP1 (different position) | 0.66*** | 0.15 |
| MLT ~ ISP 2(overall) | 0.76*** | 0.51 |
| MLT ~ ISP 2 (same position) | 0.76*** | 0.64 |
| MLT ~ ISP 2 (different position) | 0.76*** | 0.23 |
| MLT ~ ISP1 (baseline) | 0.74*** | 0.56 |
| MLT ~ ISP1 (hot) | 0.63*** | 0.46 |
| MLT ~ ISP1 (cold) | 0.63*** | 0.50 |
| MLT ~ ISP 2 (baseline) | 0.95*** | 0.71 |
| MLT ~ ISP 2(hot) | 0.76*** | 0.51 |
| MLT ~ ISP 2 (cold) | 0.76*** | 0.49 |
Table 7
Standardized coefficients, p-values, and ηp2 for the correlation between the average of the two ISP sensors and the MLT probe (confirmatory sample).
| Standardized coefficients (beta) | ηp2 | |
|---|---|---|
| MLT ~ ISP average (overall) | 0.84*** | 0.88 |
| MLT ~ ISP average (baseline) | 0.88*** | 0.90 |
| MLT ~ ISP average (hot) | 0.85*** | 0.88 |
| MLT ~ ISP average (cold) | 0.87*** | 0.90 |
[i] * Denotes p < 0.05, ** denotes p < 0.01, and *** denotes p < 0.001.
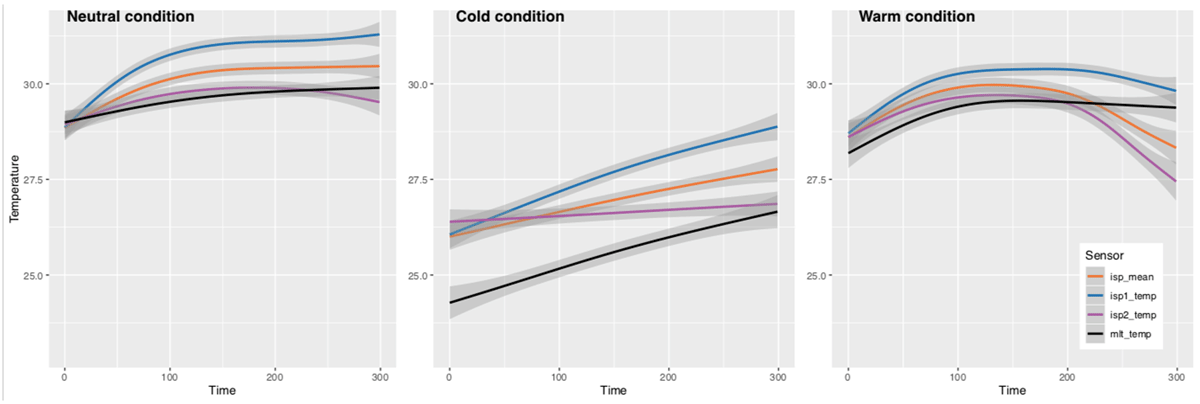
Figure 4
Visual representation of correlations between sensors in 3 experimental conditions (confirmatory sample).