
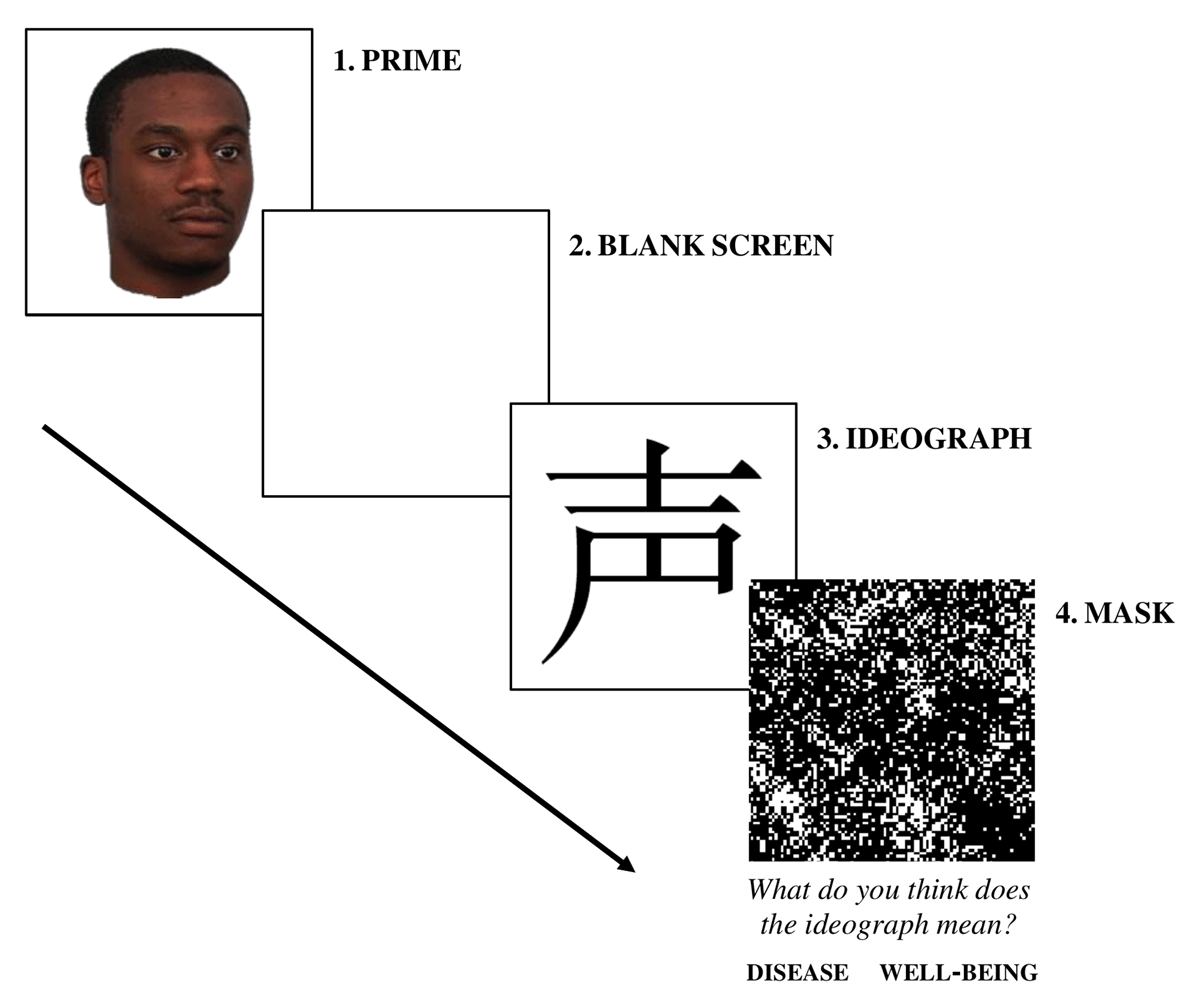
Figure 1
Study 1: Schematic representation of the SMP.
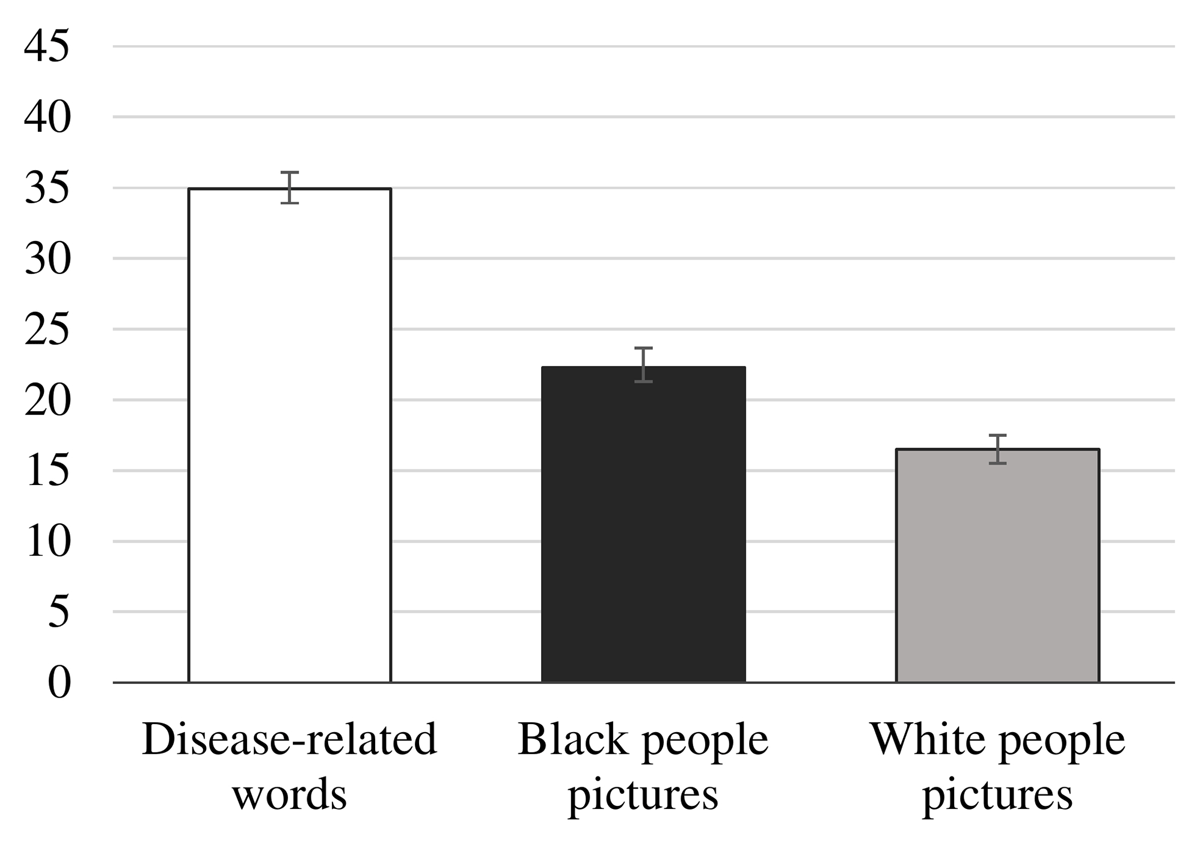
Figure 2
Study 1: Frequency of guessing a disease-related meaning of the Chinese ideograph as a function of the preceding prime category (disease-related words, Black people pictures, White people pictures).
Table 1
Study 1: Standard multiple regression statistics for the dependent variable implicit biologization, with independent variables physical and moral disgust.
| B | t | 95% Confidence Interval | sr2 (%) | RW (%) | ||
|---|---|---|---|---|---|---|
| Lower | Upper | |||||
| Physical disgust | 0.27 | 2.21 | 0.03 | 0.51 | 5.11 | 6.7 |
| Moral disgust | 0.04 | 0.31 | –0.20 | 0.28 | 0.10 | 1.7 |
| R | 0.29* | |||||
| R2 | 0.08 | |||||
| Adjusted R2 | 0.06 | |||||
| F | 3.96* | |||||
[i] Note: Unique variability = 5%; shared variability = 3%. RW = relative weights. sr2 = unique variance in implicit biologization accounted for uniquely by each independent variable.
* p ≤ .05.
Table 2
Means and standard deviations for the frequency of guessing a disease-related meaning of the Chinese ideograph as a function of disgust (physical disgust vs. moral disgust vs. non-disgusting condition) and the preceding prime category (target related, non-target related).
| Mean frequency of guessing a disease-related meaning | ||||
|---|---|---|---|---|
| Target related | Non-target related | |||
| M | SD | M | SD | |
| Physical disgust | 27.07b | 6.92 | 22.97a | 6.29 |
| Moral disgust | 23.04a | 7.27 | 21.48a | 7.12 |
| Non-disgusting | 23.03a | 5.49 | 23.32a | 6.26 |
[i] Note: The different letters, in the same row or column, indicate that the difference between the two means is significant, p ≤ .05.
Table 3
Study 3: Means and standard deviations for the frequency of guessing a disease-related meaning of the Chinese ideograph as a function of disgust (physical disgust vs. moral disgust vs. non-disgusting condition) and the preceding prime category (target related, non-target related).
| Mean frequency of guessing a disease-related meaning | ||||
|---|---|---|---|---|
| Target related | Non-target related | |||
| M | SD | M | SD | |
| Physical disgust | 25.68b | 5.90 | 22.97a | 6.13 |
| Moral disgust | 23.11a | 4.40 | 23.92a | 5.07 |
| Non-disgusting | 23.11a | 4.54 | 24.28a | 4.74 |
[i] Note: The different letters, in the same row or column, indicate that the difference between the two means is significant, p ≤ .05.