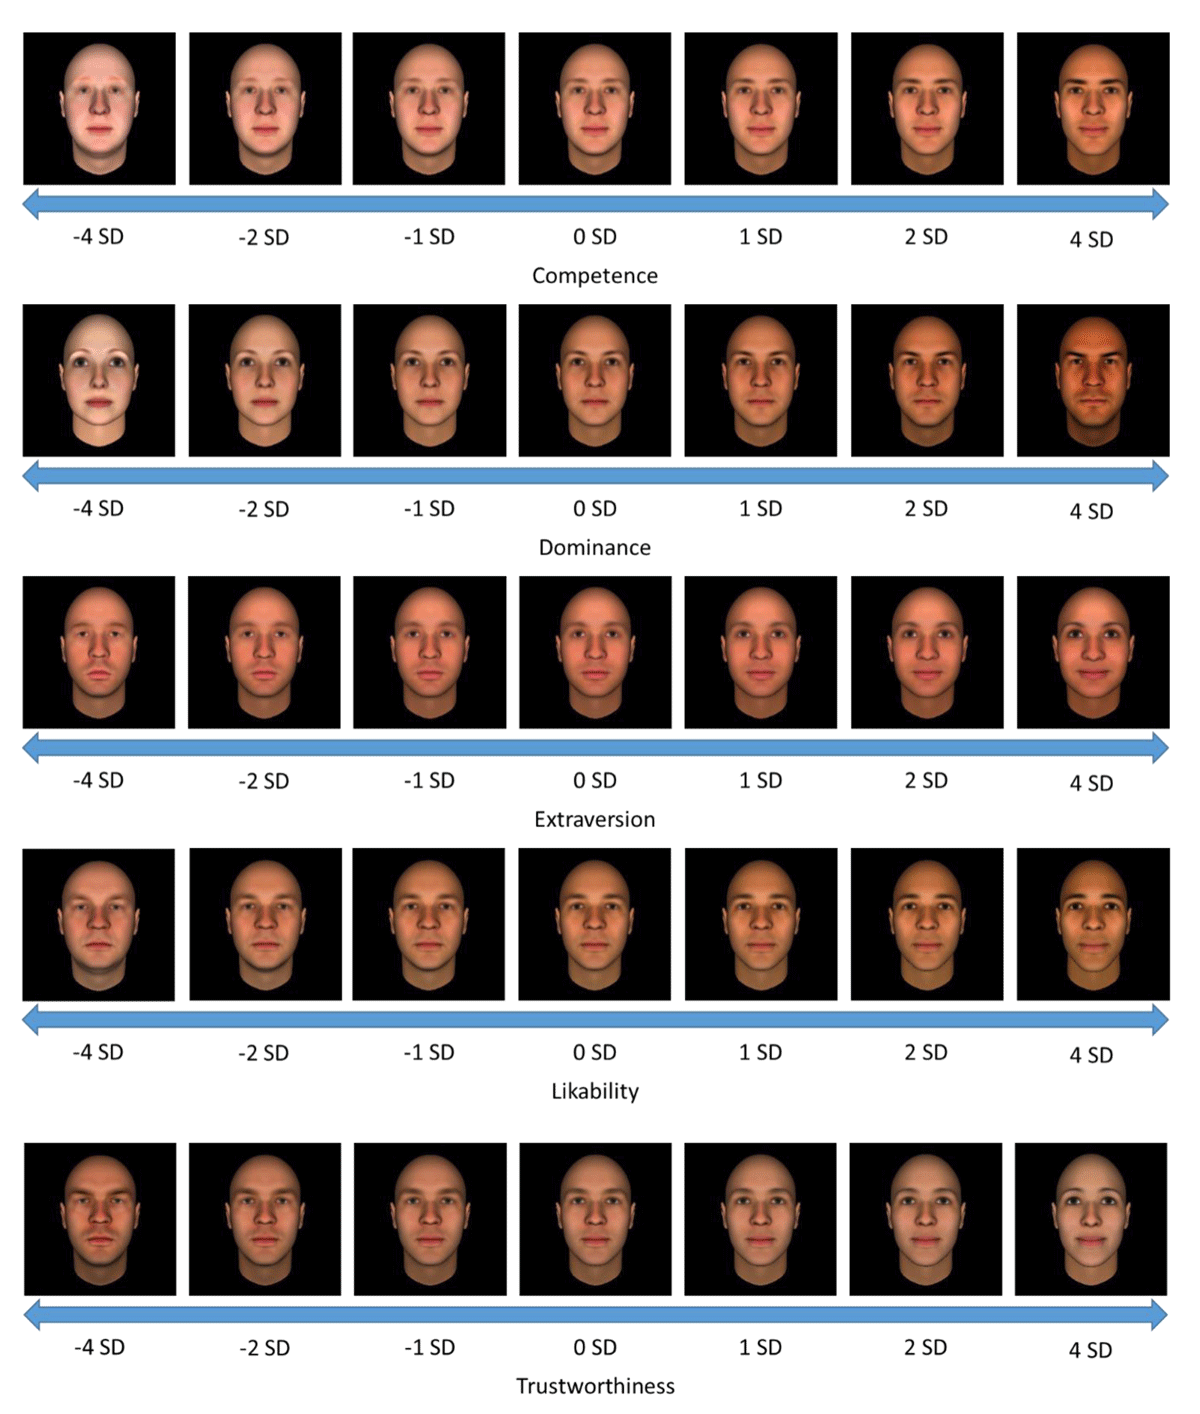
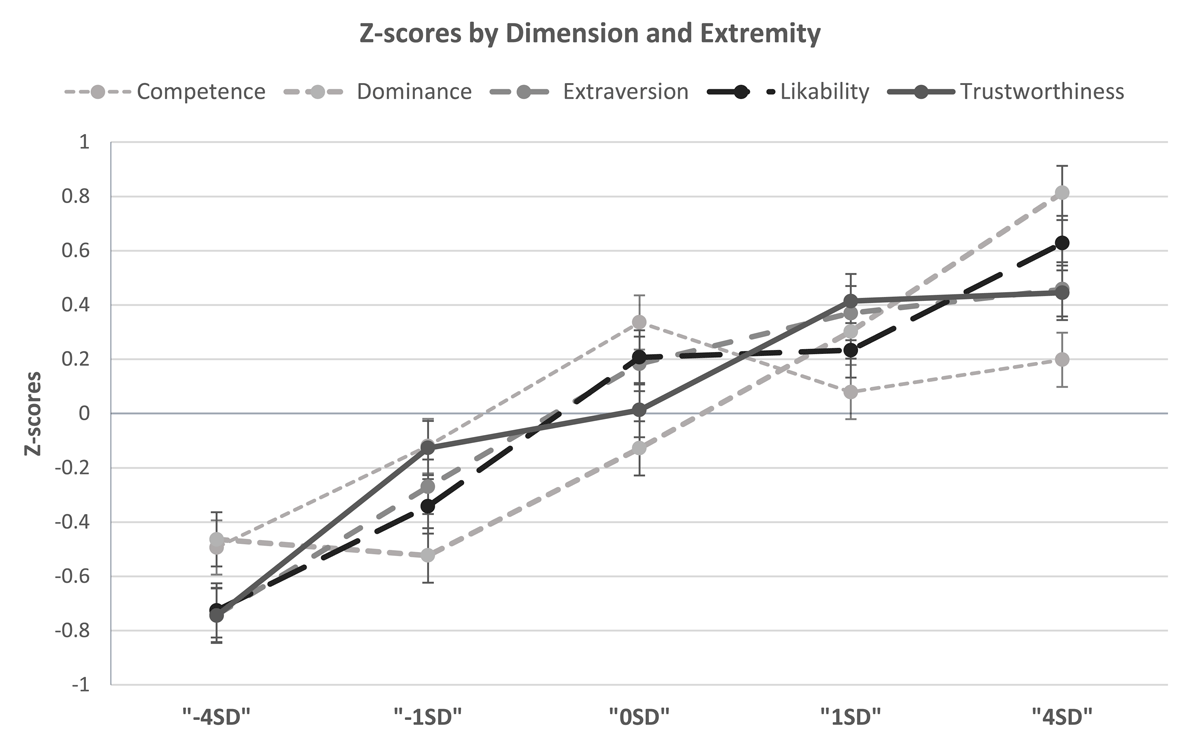
Figure 1
Means and standard errors of Z transformed responses for each extremity step measured.
Table 1
Mean differences and standard errors by Extremity level.
| –1SD | 0SD | 1SD | 4SD | |||||
|---|---|---|---|---|---|---|---|---|
| ΔM | SE | ΔM | SE | ΔM | SE | ΔM | SE | |
| –4SD | –0.358 | 0.069 | –0.756 | 0.068 | –0.914 | 0.083 | –1.143 | 0.081 |
| –1SD | –0.399 | 0.056 | –0.556 | 0.068 | –0.785 | 0.068 | ||
| 0SD | –0.157 | 0.059 | –0.386 | 0.055 | ||||
| 1SD | –0.229 | 0.062 | ||||||
[i] Note: All differences were significant, p < .01.
Table 2
Separate analyses of linear trends of extremity per dimension with the related items.
| Df | F-value | Sig. | ηp2 [90% CI] | |
|---|---|---|---|---|
| Competence (reversed): | ||||
| “How often does the target make a mistake at work per month?” | 1, 80 | 22.05 | <0.001 | 0.216 [0.095; 0.336] |
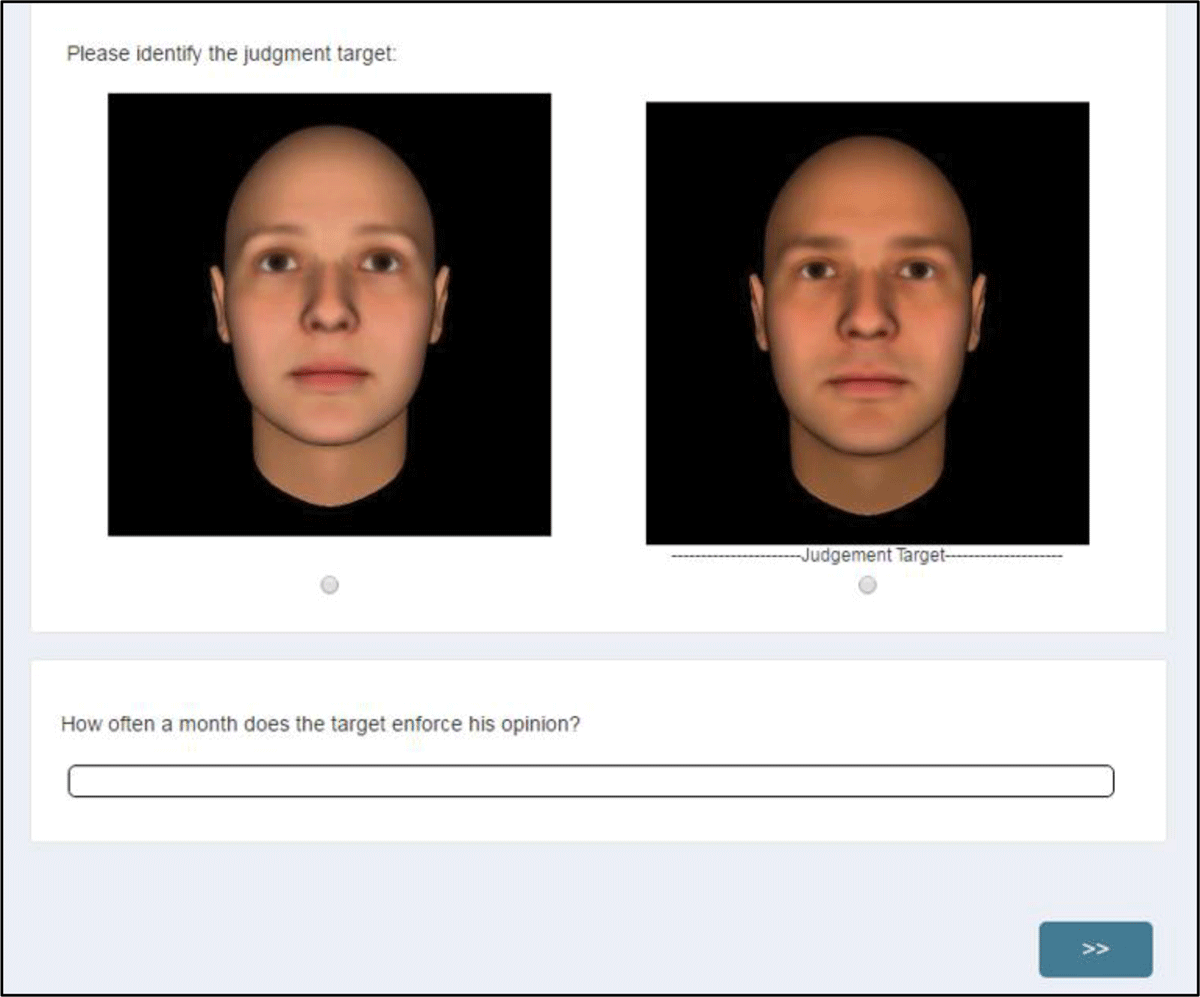
| Dominance: | ||||
| “How often a month does the target enforce his opinion?” | 1, 80 | 95.68 | <0.001 | 0.545 [0.418; 0.631] |
| Extraversion: | ||||
| “How often does the target go out a month?” | 1, 80 | 76.25 | <0.001 | 0.488 [0.095; 0.336] |
| Likability: | ||||
| “How often does the target offer help to a stranger a month?” | 1, 80 | 123.57 | <0.001 | 0.607 [0.355; 0.583] |
| Trustworthiness (reversed): | ||||
| “How often does the target deceive somebody every month?” | 1, 80 | 72.43 | <0.001 | 0.475 [0.341; 0.572] |
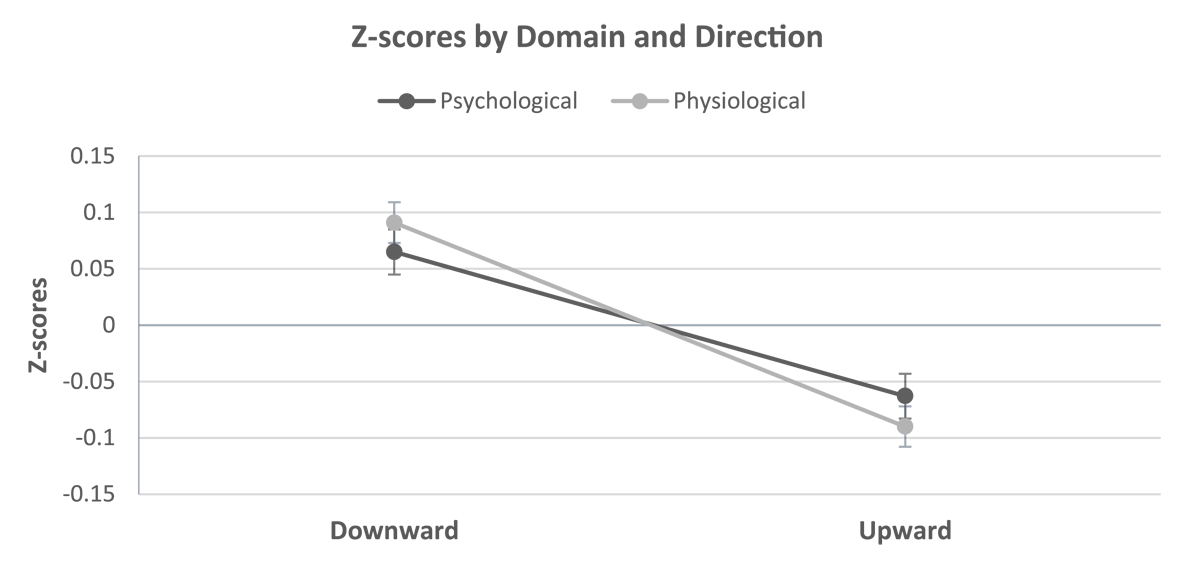
Figure 2
Means and standard errors of z-transformed responses separate for the two domains and the direction of the comparison.
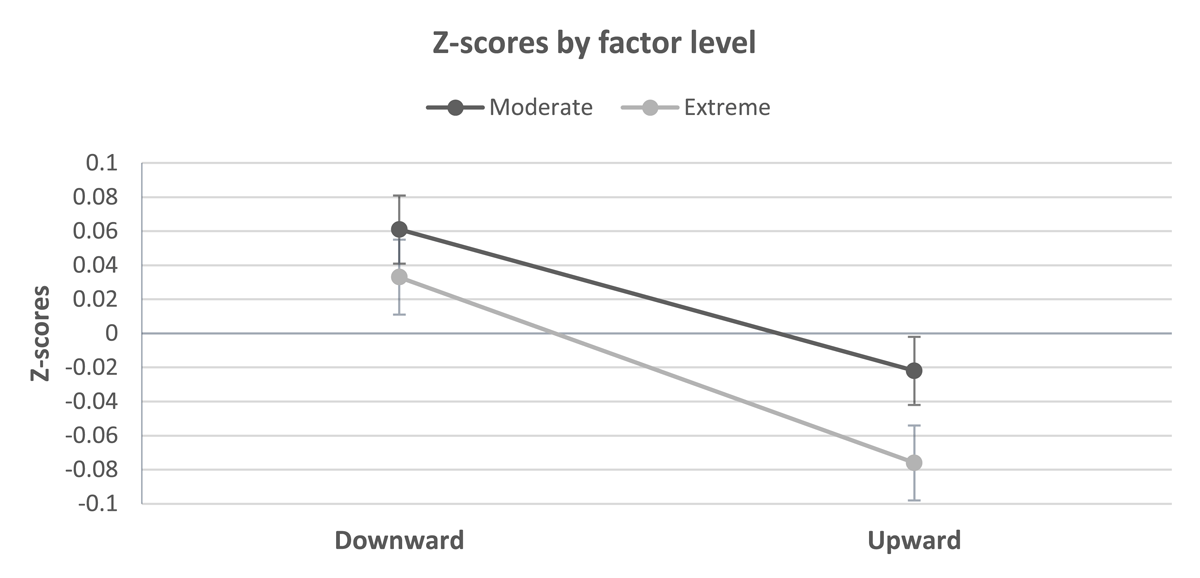
Figure 3
Means and standard errors of Z transformed responses for all dimensions separate for the direction of the comparison and its extremity (+/–2SD, or +/–4SD).
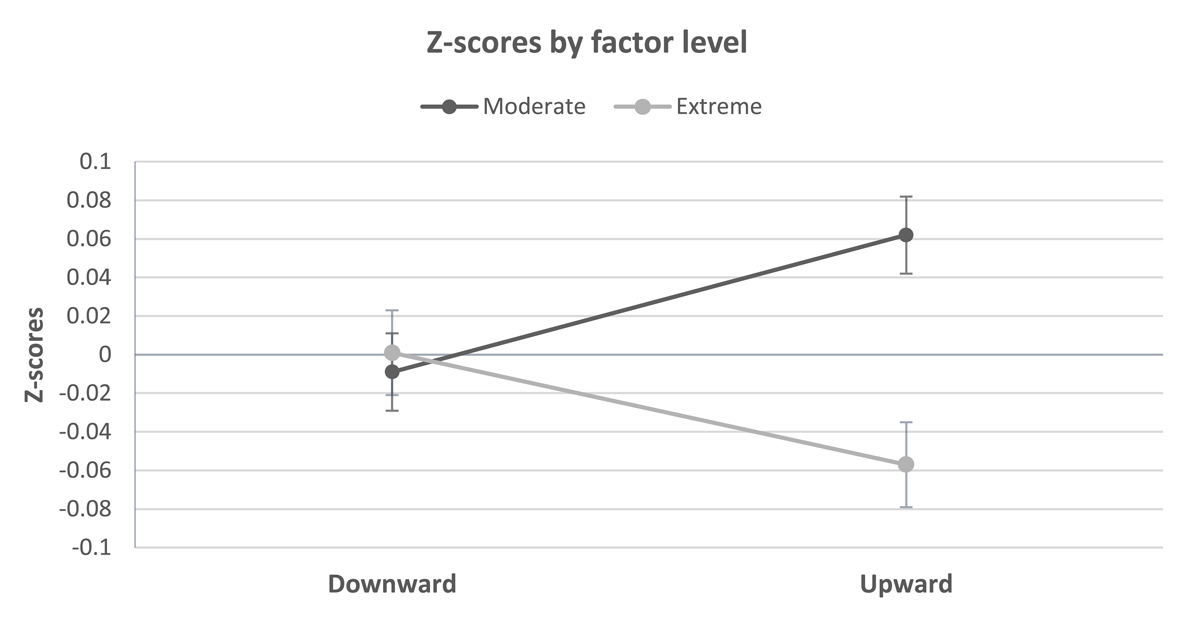
Figure 4
Means and standard errors of Z transformed responses for all dimensions separate for the direction of the comparison and its extremity (+/–1SD, or +/–4SD).

Figure 5
Means and standard errors of Z transformed responses for all dimensions, separately for the direction of the comparison and for each of the extremity conditions (+/–1SD, or +/–4SD).
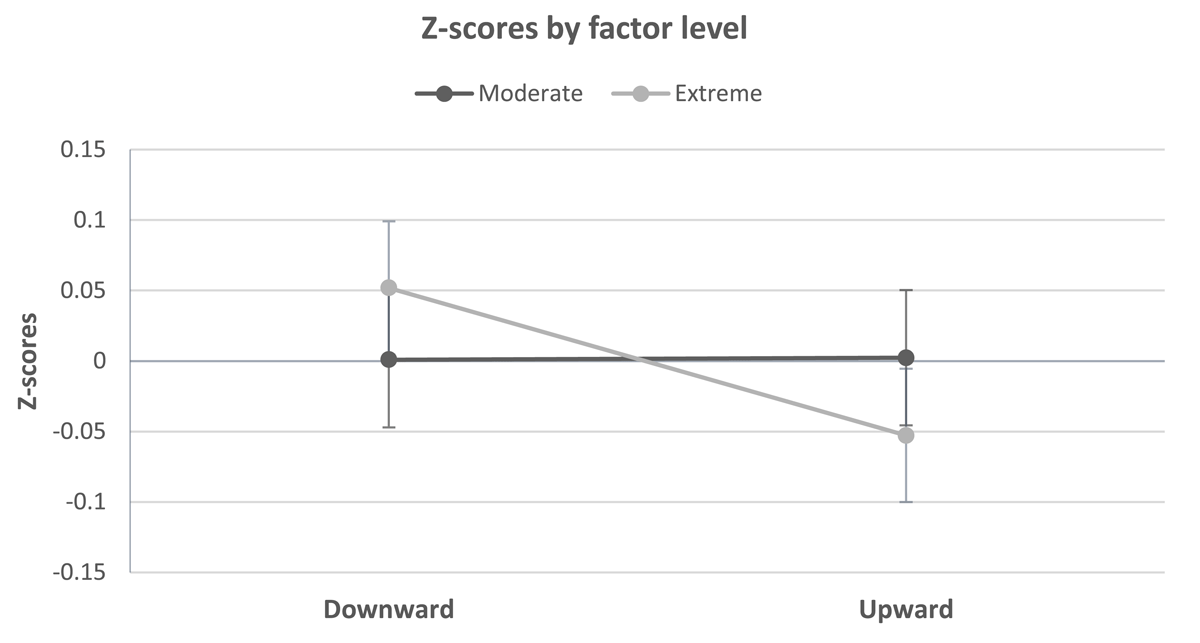
Figure 6
Estimated marginal means and standard errors of Z transformed responses over all studies shown separately for the direction of the comparison and for each of the extremity conditions.
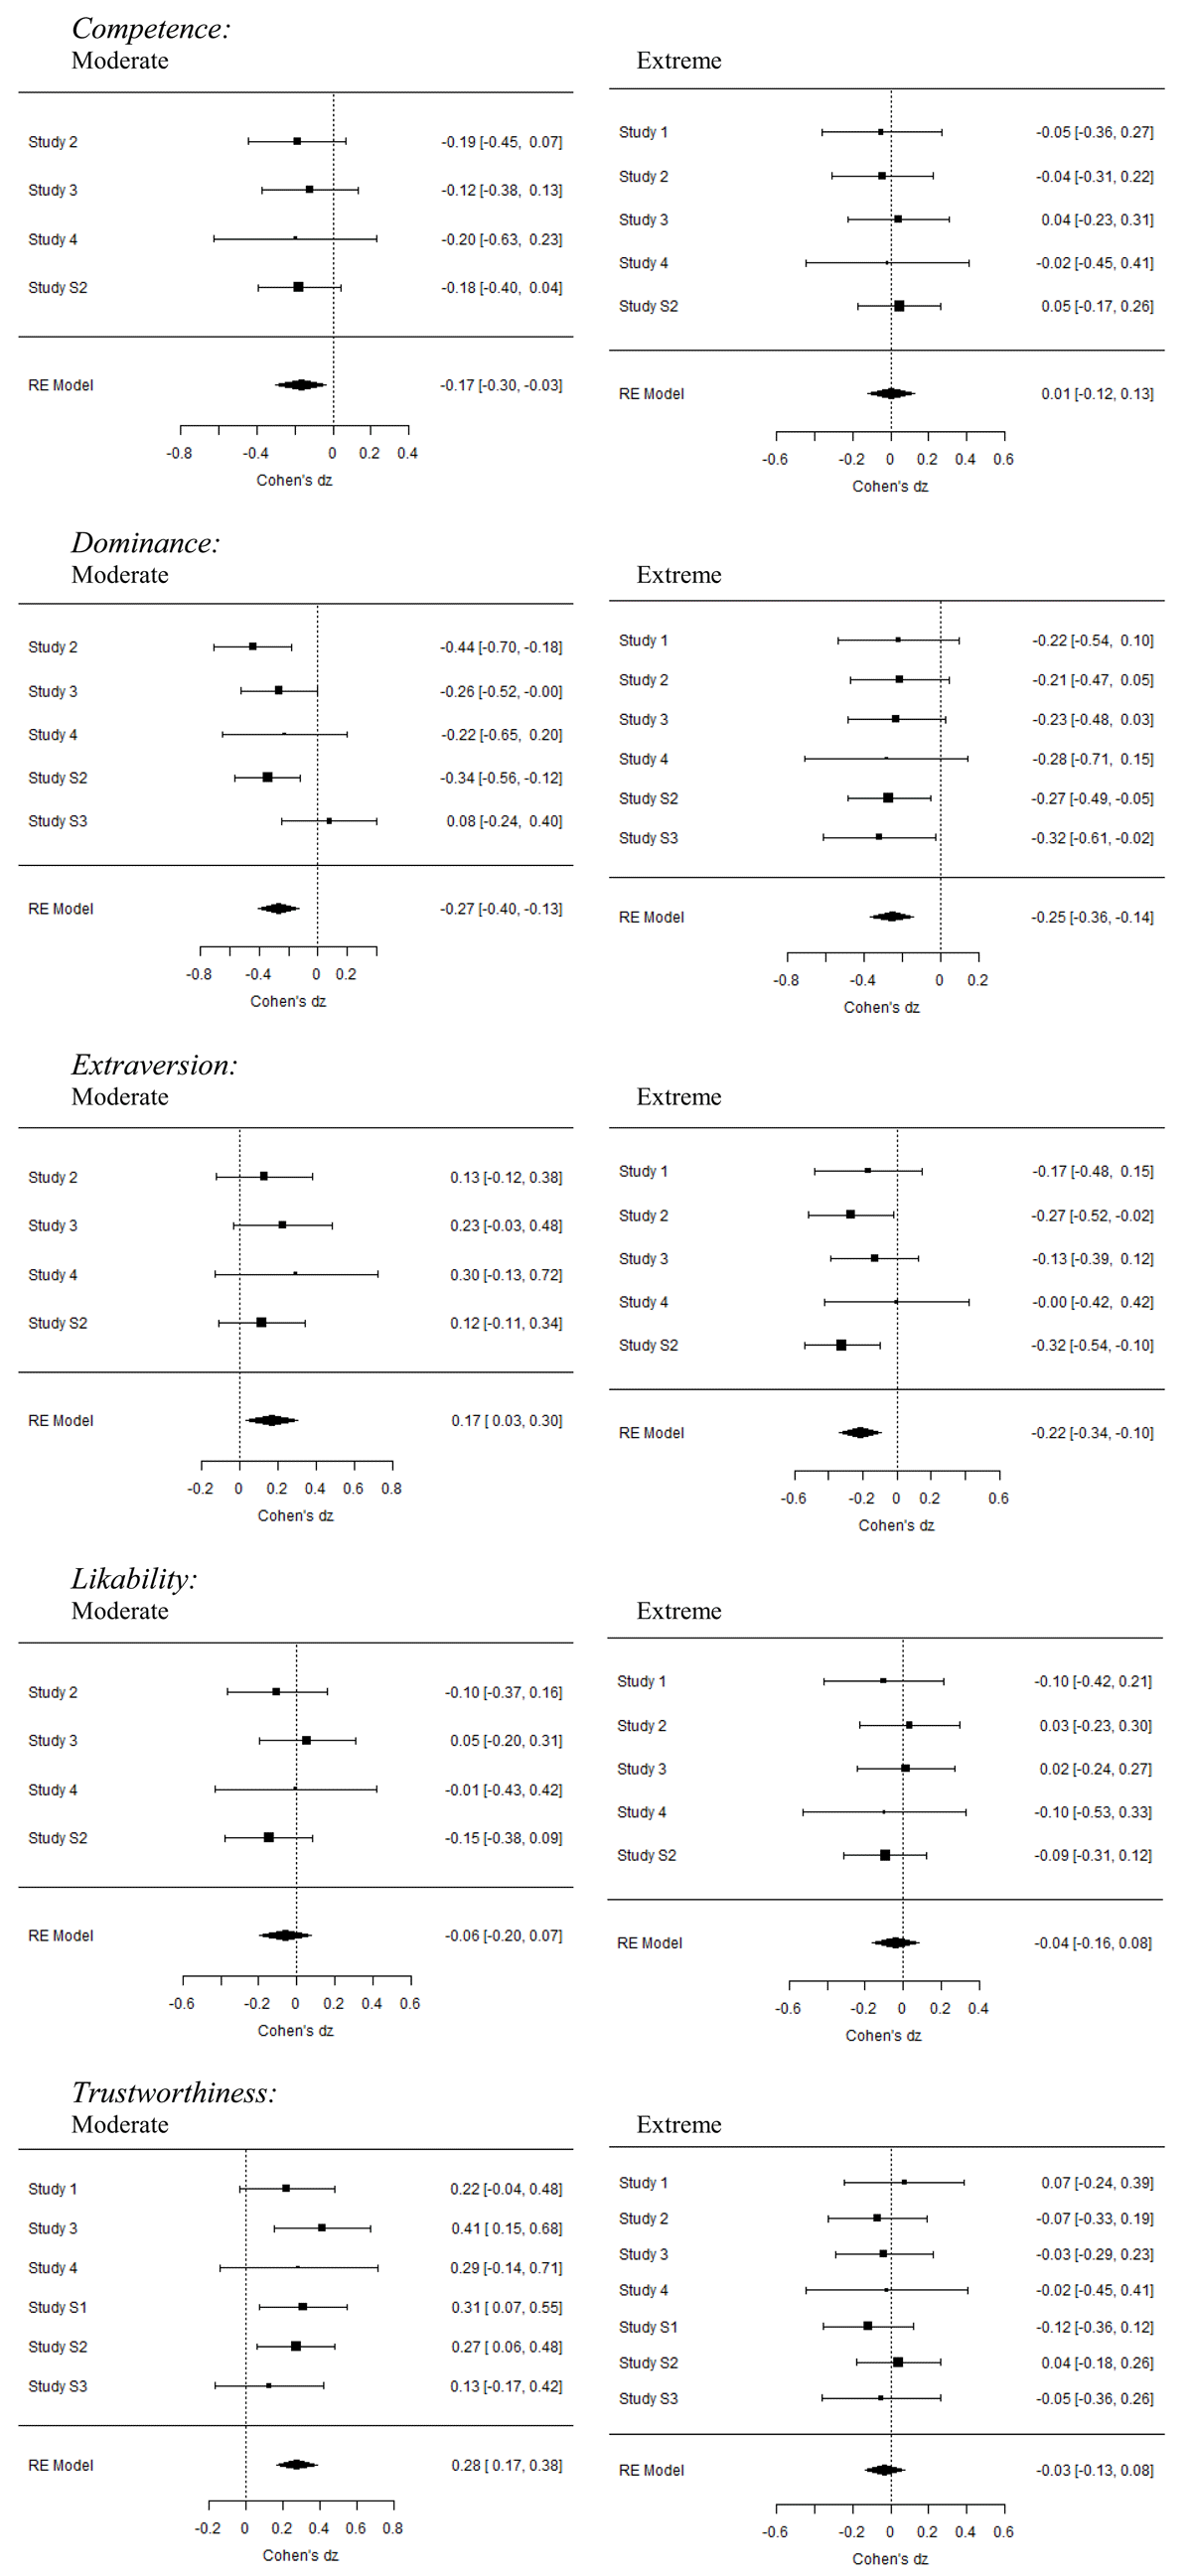
Table 3
Facial dimensions and their meta-analytic assimilation and contrast effects across all the studies for Moderate standards.
| K | I2 | Meta-analytic dz (95% CI) | Z | p | |
|---|---|---|---|---|---|
| Facial dimension | |||||
| Competence | 4 | 0% | –0.166 [–0.299; –0.034] | –2.456 | 0.014 |
| Dominance | 5 | 17.81% | –0.266 [–0.405; –0.127] | –3.742 | <0.001 |
| Extraversion | 4 | 0% | 0.168 [0.035; 0.302] | 2.469 | 0.014 |
| Likeability | 4 | 0% | –0.063 [–0.199; 0.073] | –0.903 | 0.367 |
| Trustworthiness | 6 | 0% | 0.277 [0.169; 0.384] | 5.041 | <0.001 |
Table 4
Facial dimensions and their meta-analytic assimilation and contrast effects across all the studies for Extreme standards.
| K | I2 | Meta-analytic dz (95% CI) | Z | p | |
|---|---|---|---|---|---|
| Facial dimension | |||||
| Competence | 5 | 0% | 0.006 [–0.119; 0.130] | 0.089 | 0.929 |
| Dominance | 6 | 0% | –0.252 [–0.365; –0.139] | –4.360 | <0.001 |
| Extraversion | 5 | 0% | –0.217 [–0.338; –0.096] | –3.519 | <0.001 |
| Likeability | 5 | 0% | –0.042 [–0.164; 0.080] | –0.670 | 0.503 |
| Trustworthiness | 7 | 0% | –0.026 [–0.131; 0.076] | –0.520 | 0.603 |