
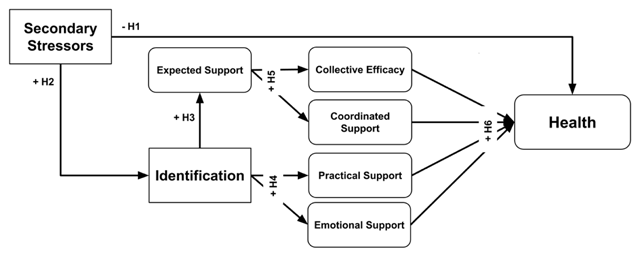
Figure 1
Summary of main hypotheses of Study 1.
Table 1
Descriptive statistics and correlations.
| Min Max | M | SD | 1 | 2 | 3 | 4 | 5 | 6 | |||||||
|---|---|---|---|---|---|---|---|---|---|---|---|---|---|---|---|
| 1. | Collective efficacy | 1/7 | 4.58 | 1.83 | |||||||||||
| 2. | Expected support | 1/7 | 4.56 | 1.96 | 0.267 | *** | |||||||||
| 3. | Practical support | 1/5 | 3.40 | 1.18 | 0.197 | ** | 0.072 | ||||||||
| 4. | Shared social Identity | 1/5 | 2.22 | 0.99 | 0.201 | ** | 0.582 | *** | 0.167 | * | |||||
| 5. | Coordinated support | 1/5 | 3.14 | 0.66 | 0.110 | 0.129 | * | 0.560 | *** | 0.193 | ** | ||||
| 6. | Emotional support | 1/7 | 5.01 | 1.56 | 0.093 | 0.124 | 0.608 | *** | 0.212 | ** | 0.434 | *** | |||
| 7. | General health | 1/5 | 3.45 | 1.20 | 0.205 | ** | 0.094 | 0.079 | 0.100 | 0.112 | 0.006 | ||||
[i] *p < 0.05, **p < 0.01, ***p < 0.001.
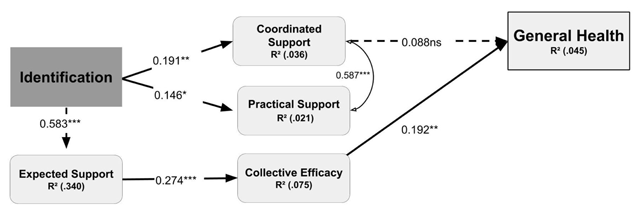
Figure 2
Standarised results of path analysis using multiple regression analyses.
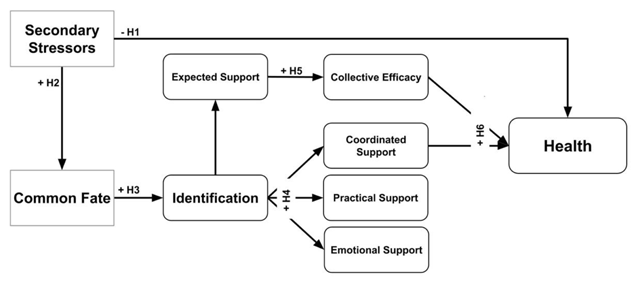
Figure 3
Summary of main hypotheses of Study 2.
Table 2
Descriptive statistics and correlations.
| Min Max | M | SD | 1 | 2 | 3 | 4 | 5 | 6 | 7 | 8 | 9 | 10 | |||||||||||
|---|---|---|---|---|---|---|---|---|---|---|---|---|---|---|---|---|---|---|---|---|---|---|---|
| 1. | Shared Identity | 0/4 | 2.41 | 1.01 | |||||||||||||||||||
| 2. | Expected Support | 0/4 | 2.02 | 0.90 | 0.609 | ** | |||||||||||||||||
| 3. | Collective Efficacy | 0/4 | 1.82 | 0.78 | 0.381 | *** | 0.392 | *** | |||||||||||||||
| 4. | Practical Support | 0/4 | 1.83 | 1.22 | 0.313 | *** | 0.137 | 0.116 | |||||||||||||||
| 5. | Coordinated sup. | 0/4 | 1.24 | 1.03 | 0.298 | *** | 0.233 | ** | 0.105 | 0.591 | *** | ||||||||||||
| 6. | General Health | 0/4 | 2.11 | 0.66 | 0.152 | 0.156 | 0.234 | ** | 0.098 | 0.187 | * | ||||||||||||
| 7. | Stress | 0/4 | 2.09 | 0.60 | –0.068 | –0.066 | –0.117 | –0.086 | –0.182 | * | –0.570 | *** | |||||||||||
| 8. | Common Fate | 0/4 | 2.16 | 1.06 | 0.418 | *** | 0.419 | *** | 0.069 | 0.167 | * | 0.235 | ** | –0.042 | 0.13 | ||||||||
| 9. | Secondary Stressors | 0/4 | 1.98 | 0.73 | 0.088 | 0.032 | –0.024 | –0.013 | –0.275 | ** | –0.09 | 0.280 | *** | 0.085 | |||||||||
| 10. | Emotional support | 0/4 | 2.89 | 1.00 | 0.288 | *** | 0.212 | ** | 0.271 | ** | 0.404 | *** | 0.298 | *** | 0.166 | * | –0.043 | 0.068 | 0.230 | ** | |||
| 11. | Time in Exile | 1/5 | 4.12 | 0.83 | 0.057 | –0.046 | –0.089 | 0.116 | 0.068 | 0.058 | 0.082 | 0.137 | 0.163 | * | .320 | *** | |||||||
[i] *p < 0.05, **p < 0.01, ***p < 0.001.
Table 3
Indirect specific effects.
| β | 95%CI | |||||
|---|---|---|---|---|---|---|
| Secondary Stressors ➔ | Stress ➔ | General health | –0.153 | –0.231, –0.076 | ||
| Secondary Stressors ➔ | Coordinated support ➔ | General health | –0.021 | –0.055, 0.010 | ||
| Common Fate ➔ | Shared Social Identity ➔ | Collective efficacy ➔ | General health | 0.015 | 0.004, 0.043 | |
| Common Fate ➔ | Expected Support ➔ | Collective efficacy ➔ | General health | 0.009 | 0.001, 0.03 | |
| Common Fate ➔ | Shared Social Identity ➔ | Coordinated support ➔ | General health | 0.010 | –0.003, 0.031 | |
| Common Fate ➔ | Shared Social Identity ➔ | Expected Support ➔ | Collective efficacy ➔ | General health | 0.010 | 0.002, 0.029 |
| Shared Social Identity ➔ | Collective efficacy ➔ | General health | 0.037 | 0.007, 0.094 | ||
| Shared Social Identity ➔ | Coordinated support ➔ | General health | 0.024 | –0.009, 0.068 | ||
| Shared Social Identity ➔ | Expected Support ➔ | Collective efficacy ➔ | General health | 0.023 | 0.003, 0.065 | |
| Expected Support ➔ | Collective efficacy ➔ | General health | 0.044 | 0.006, 0.115 | ||
| Common Fate ➔ | Shared Social Identity ➔ | Collective efficacy | 0.092 | 0.026, 0.187 | ||
| Common Fate ➔ | Expected Support ➔ | Collective efficacy | 0.052 | 0.013, 0.120 | ||
| Common Fate ➔ | Shared Social Identity ➔ | Expected Support ➔ | Collective efficacy | 0.058 | 0.019, 0.116 | |
| Common Fate ➔ | Shared Social Identity ➔ | Coordinated support | 0.135 | 0.073, 0.214 | ||
| Common Fate ➔ | Shared Social Identity ➔ | Practical support | 0.131 | 0.072, 0.213 | ||
| Common Fate ➔ | Shared Social Identity ➔ | Expected support | 0.220 | 0.146, 0.311 | ||
| Shared Social Identity ➔ | Expected Support ➔ | Collective efficacy | 0.138 | 0.043, 0.252 |
[i] Note. Bootstrap is based on 5000 re-samples. When confidence intervals do not include zero this shows that there is a significant indirect effect (Preacher & Hayes, 2008; Williams & MacKinnon, 2008). Standardized coefficients are shown.
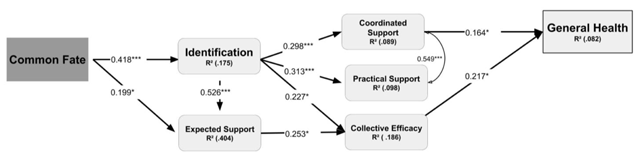
Figure 4
Standardised results of path analysis using multiple regression analyses.
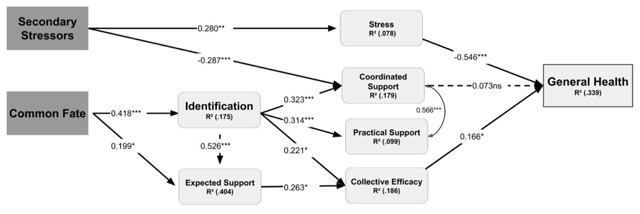
Figure 5
Model of the process of shared identity-based support among the refugees and its effect on their general health, in the presence of secondary stressors (full model).
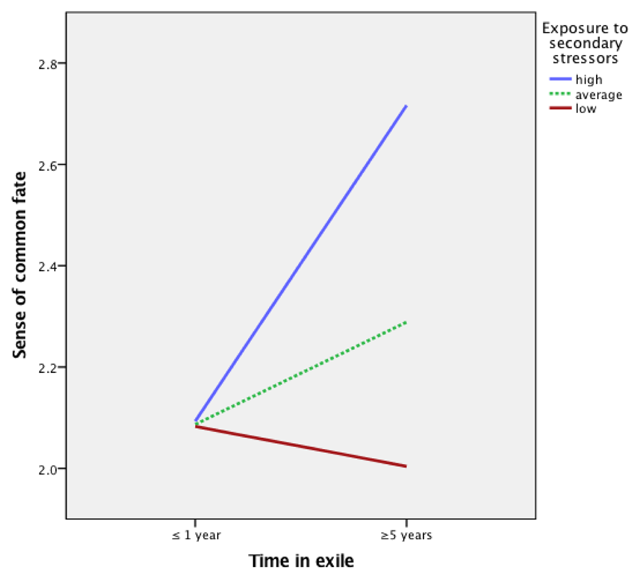
Figure 6
Interaction between time spent in exile, sense of common fate, and exposure to secondary stressors.
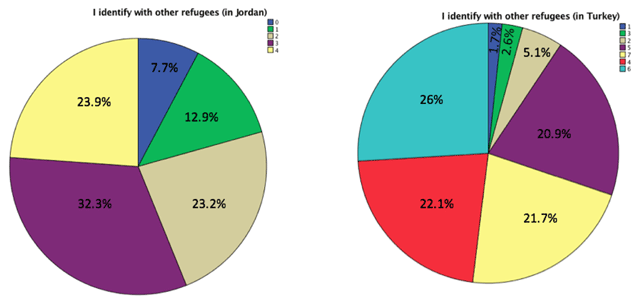
Figure 7
Response of participants to a question about identification with other refugees (from 7 “Strongly Disagree” to 1 “Strongly Agree”).