
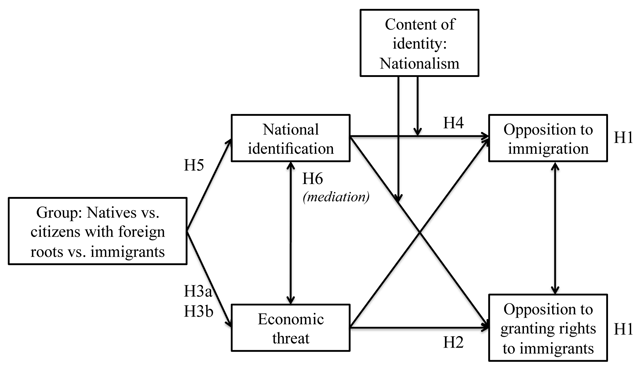
Figure 1
Summary of predictions.
Table 1
Means, standard deviations and intercorrelations of independent and dependant variables, by group.
| M | SD | Correlations | ||||
|---|---|---|---|---|---|---|
| 2 | 3 | 4 | 5 | |||
| Natives | ||||||
| 1 National identification | 3.42 | 0.63 | 0.23*** | 0.12*** | 0.17*** | 0.27*** |
| 2 Nationalism | 3.00 | 0.91 | 0.25*** | 0.35*** | 0.24*** | |
| 3 Economic threat | 2.74 | 0.80 | 0.55*** | 0.34*** | ||
| 4 Opposition—newcomers | 3.44 | 0.81 | 0.45*** | |||
| 5 Opposition—rights | 3.25 | 0.98 | ||||
| Citizens of foreign descent | ||||||
| 1 National identification | 3.33 | 0.67 | 0.23*** | 0.19*** | 0.22*** | 0.25** |
| 2 Nationalism | 3.00 | 0.92 | 0.21** | 0.26*** | 0.20** | |
| 3 Economic threat | 2.54 | 0.73 | 0.49*** | 0.29** | ||
| 4 Opposition—newcomers | 3.24 | 0.82 | 0.43*** | |||
| 5 Opposition—rights | 2.96 | 0.89 | ||||
| Immigrants | ||||||
| 1 National identification | 3.24 | 0.67 | 0.36*** | 0.11 | 0.23** | 0.09 |
| 2 Nationalism | 3.34 | 0.99 | 0.08 | 0.19** | 0.10 | |
| 3 Economic threat | 2.38 | 0.73 | 0.28*** | 0.19** | ||
| 4 Opposition—newcomers | 3.06 | 0.78 | 0.19** | |||
| 5 Opposition—rights | 2.85 | 0.93 | ||||
[i] Note. *** p < 0.001, ** p < 0.01
Table 2
Results of path model.
| National identification | Economic Threat | Opposition newcomers | Opposition rights | |||||
|---|---|---|---|---|---|---|---|---|
| b | (SE) | b | (SE) | b | (SE) | b | (SE) | |
| Contrast 1 (C1) | 0.03 | (0.01)* | 0.09 | (0.02)*** | 0.06 | (0.01)*** | 0.07 | (0.02)*** |
| Contrast 2 (C2) | 0.03 | (0.03) | 0.07 | (0.04)* | 0.10 | (0.03)** | 0.04 | (0.05) |
| Nat. id. (NI) | 0.09 | (0.03)** | 0.17 | (0.05)*** | ||||
| Nationalism (NAT) | 0.15 | (0.02)*** | 0.10 | (0.03)** | ||||
| Economic threat (ET) | 0.40 | (0.03)*** | 0.29 | (0.03)*** | ||||
| ET × C1 | 0.03 | (0.02) | ||||||
| ET × C2 | 0.10 | (0.04)* | ||||||
| NI × NAT | –0.06 | (0.05) | ||||||
| NI × C1 | 0.06 | (0.03)* | ||||||
| NI × C2 | 0.07 | (0.07) | ||||||
| NAT × C1 | 0.01 | (0.02) | ||||||
| NAT × C2 | 0.02 | (0.05) | ||||||
| NI × NAT × C1 | –0.05 | (0.03)† | ||||||
| NI × NAT × C2 | –0.03 | (0.06) | ||||||
| Age | 0.004 | (0.001)*** | 0.001 | (0.001) | 0.003 | (0.001)* | 0.01 | (0.001)*** |
| Gender | 0.03 | (0.04) | –0.11 | (0.04)** | –0.01 | (0.04) | –0.01 | (0.05) |
| Education | –0.16 | (0.04)*** | –0.27 | (0.05)*** | –0.14 | (0.02)** | –0.17 | (0.06)** |
| Social class | 0.03 | (0.01)*** | 0.06 | (0.02)*** | –0.02 | (0.01)† | –0.004 | (0.02) |
[i] Notes. Contrast 1: natives vs. individuals with an immigrant background; Contrast 2: citizens of foreign descent vs. immigrants.
Only interactions that yielded as a significant effect in regressions conducted on each dependent variable separately were included in the final model.
Beyond the estimates presented in Table 2, bivariate relationships between economic threat, national identification and nationalism as well as between the two facets of anti-immigration prejudice were included in the model.
*** p < 0.001, ** p < 0.01, * p < 0.05, † p < 0.10.
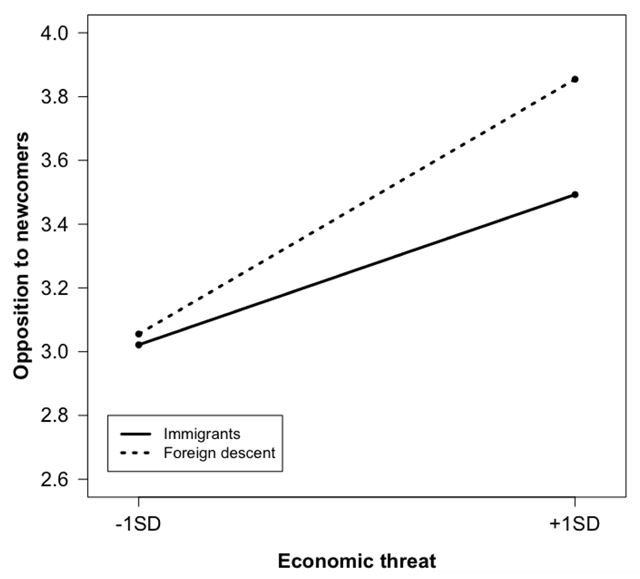
Figure 2
Relationship between perceived economic threat and opposition to newcomers among citizens of foreign descent and immigrants.
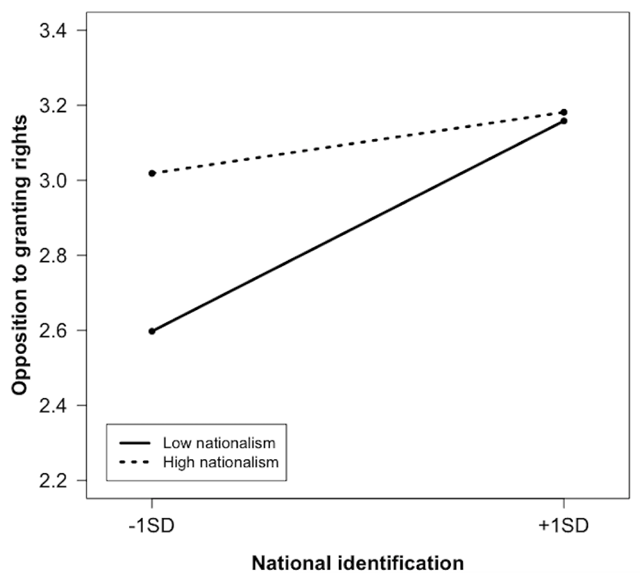
Figure 3a
Relationship between national identification and opposition to granting rights to immigrants, among natives.
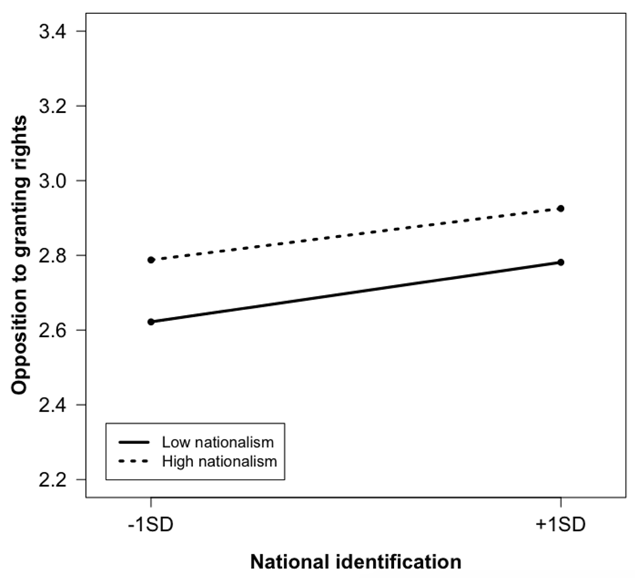
Figure 3b
Relationship between national identification and opposition to granting rights to immigrants, among individuals with an immigrant background.