
Table 1
Descriptive Statistics and Pearson’s Correlation Coefficients for the Variables Used in the Study in the Samples of Russian Immigrants in Finland (N = 316) and Estonia (N = 501).
| M | SD | Pearson’s r | ||||||||||
|---|---|---|---|---|---|---|---|---|---|---|---|---|
| 1 | 2 | 3 | 4 | 5 | 6 | |||||||
| Finland | ||||||||||||
| 1. Gender | — | — | 1 | 0.02 | 0.04 | 0.07 | 0.05 | 0.08 | ||||
| 2. Age | 44.85 | 12.24 | 1 | –0.07 | .01 | –.12 | * | –0.04 | ||||
| 3. Ethnic identification | 3.83 | 1.06 | 1 | –0.07 | 0.02 | –0.16 | ** | |||||
| 4. Socio-economic status | 2.92 | 1.14 | 1 | –0.30 | *** | 0.06 | ||||||
| 5. Ethnic discrimination | 2.73 | 1.01 | 1 | –0.26 | *** | |||||||
| 6. National identification | 3.76 | 0.91 | 1 | |||||||||
| Estonia | ||||||||||||
| 1. Gender | — | — | 1 | 0.04 | –0.02 | 0.03 | –0.03 | 0.07 | ||||
| 2. Age | 48.16 | 15.60 | 1 | 0.18 | *** | –0.12 | ** | 0.05 | –0.14 | ** | ||
| 3. Ethnic identification | 4.39 | 0.55 | 1 | –0.04 | 0.07 | –0.06 | ||||||
| 4. Socio-economic status | 1.93 | 0.94 | 1 | –0.33 | *** | 0.28 | *** | |||||
| 5. Ethnic discrimination | 3.02 | 0.95 | 1 | –0.30 | *** | |||||||
| 6. National identification | 3.47 | 0.87 | 1 | |||||||||
[i] Note. *p < 0.05. **p < 0.01. ***p < 0.001.
Table 2
Regression Analysis on the Predictors of National Identification among Russian Speakers in Finland (N = 316) and Estonia (N = 501).
| Predictor | B | SE | t | |
|---|---|---|---|---|
| Constant | 5.60 | *** | 00.43 | 13.02 |
| Gender (0 = male) | 0.15 | * | 00.06 | 2.43 |
| Age | –0.01 | ** | 00.00 | –2.86 |
| Ethnic identification | –0.12 | ** | 00.04 | –3.10 |
| Socio-economic status (SES) | –0.19 | 00.11 | –1.67 | |
| Ethnic discrimination (ED) | –0.42 | *** | 00.12 | –3.45 |
| Country (C; 0 = FIN; 1 = EST) | –1.44 | ** | 00.48 | –3.01 |
| SES × ED | 0.06 | 00.04 | 1.52 | |
| SES × C | 0.50 | ** | 00.16 | 3.07 |
| ED × C | 0.32 | * | 00.15 | 2.10 |
| SES × ED × C | –0.11 | * | 00.06 | –1.98 |
| R2 | 0.15 | |||
| F change for R2 | 14.20*** | |||
[i] Note. *p < 0.05. **p < 0.01. ***p < 0.001. FIN = Finland. EST = Estonia.
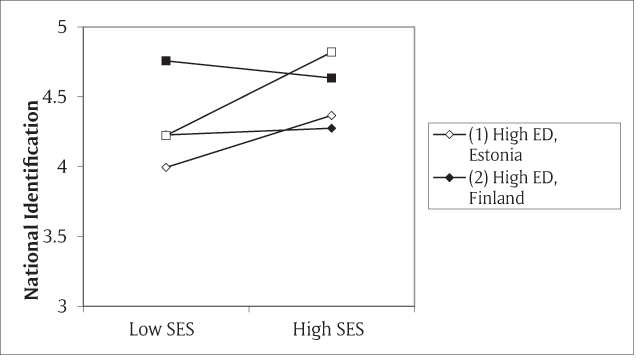
Figure 1
The relationship perceived socio-economic status (SES), ethnic discrimination (ED) and national identification of Russian speakers in Finland and Estonia.