
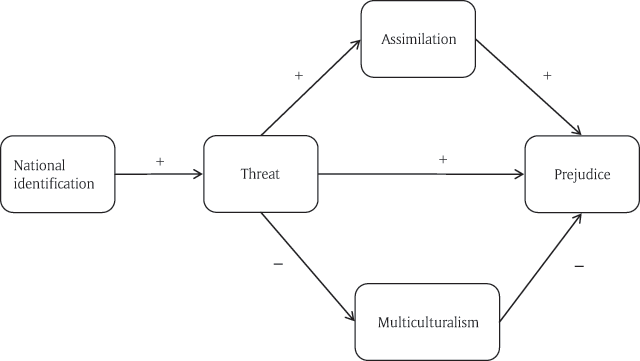
Figure 1
Hypothesized theoretical model.
Table 1
Descriptive statistics and bivariate correlations for all variables.
| M (SD) | 1 | 2 | 3 | 4 | 5 | |||||
| 1. National identification | 4.83 (1.14) | |||||||||
| 2. Perception of threat | 3.39 (1.53) | 0.17 | * | |||||||
| 3. Endorsement of assimilation | 4.41 (1.02) | 0.25 | ** | 0.51 | ** | |||||
| 4. Endorsement of multiculturalism | 4.75 (0.84) | –0.11 | –0.47 | ** | –0.28 | ** | ||||
| 5. Prejudice | 3.71 (1.41) | 0.22 | ** | 0.84 | ** | 0.59 | ** | –0.58 | ** | |
[i] Note: *p < 0.05; **p < 0.01.
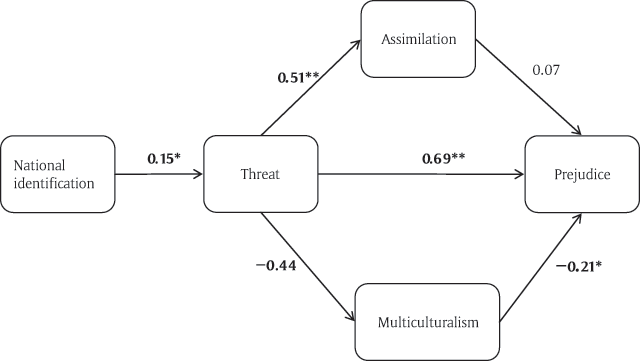
Figure 2
Hypothesized path model.
Note: Standardised parameter estimates shown. *p < 0.05, **p < 0.01.