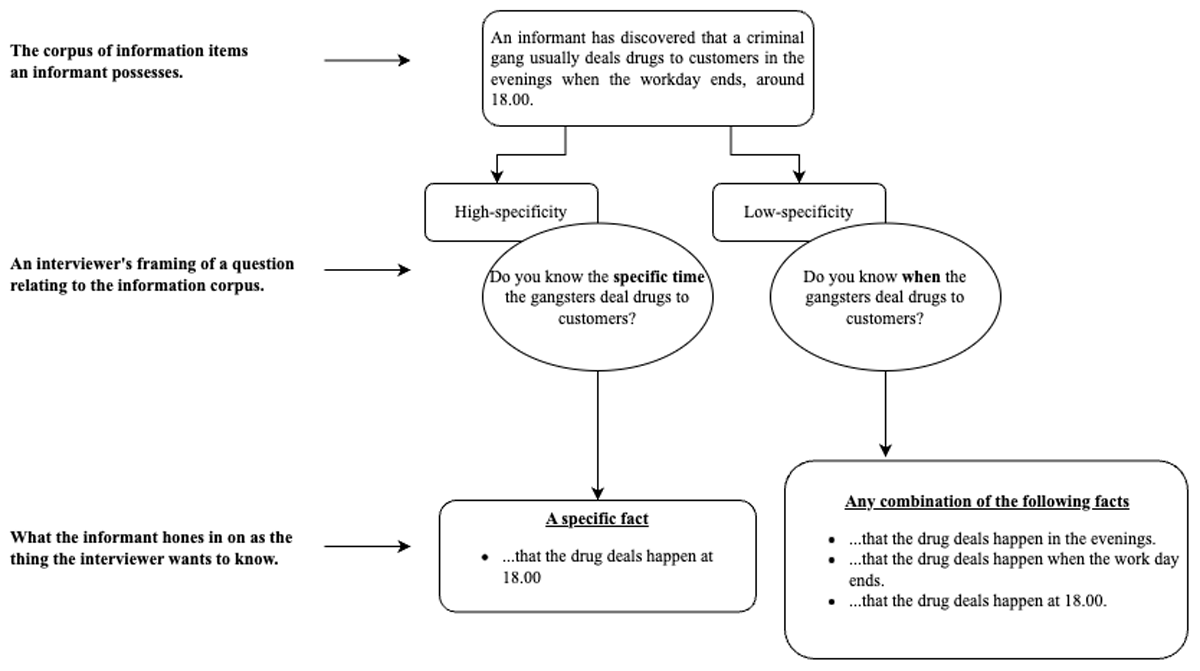
Figure 1
Proposed Mechanism Illustrating how Interviewees Determine what Interviewers Want to Know.
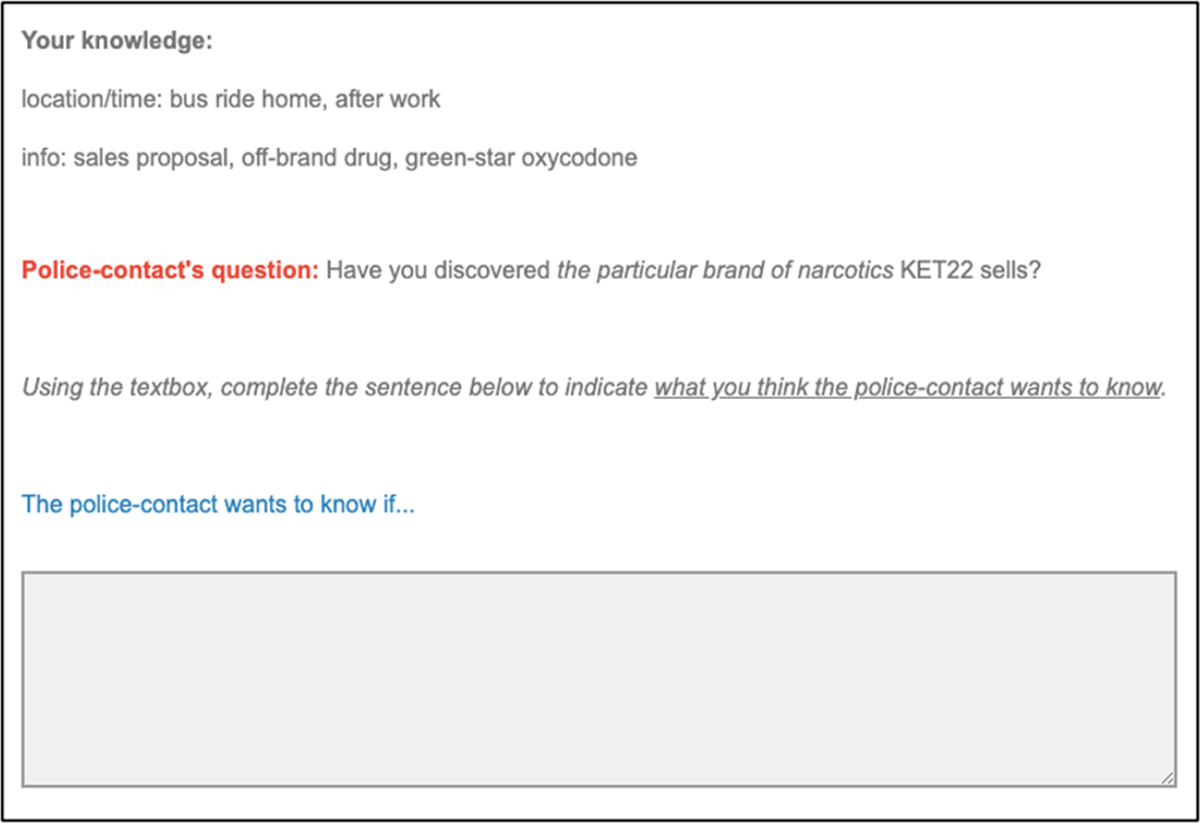
Figure 2
Illustration of Decision-making Page (with a High-specificity Question).
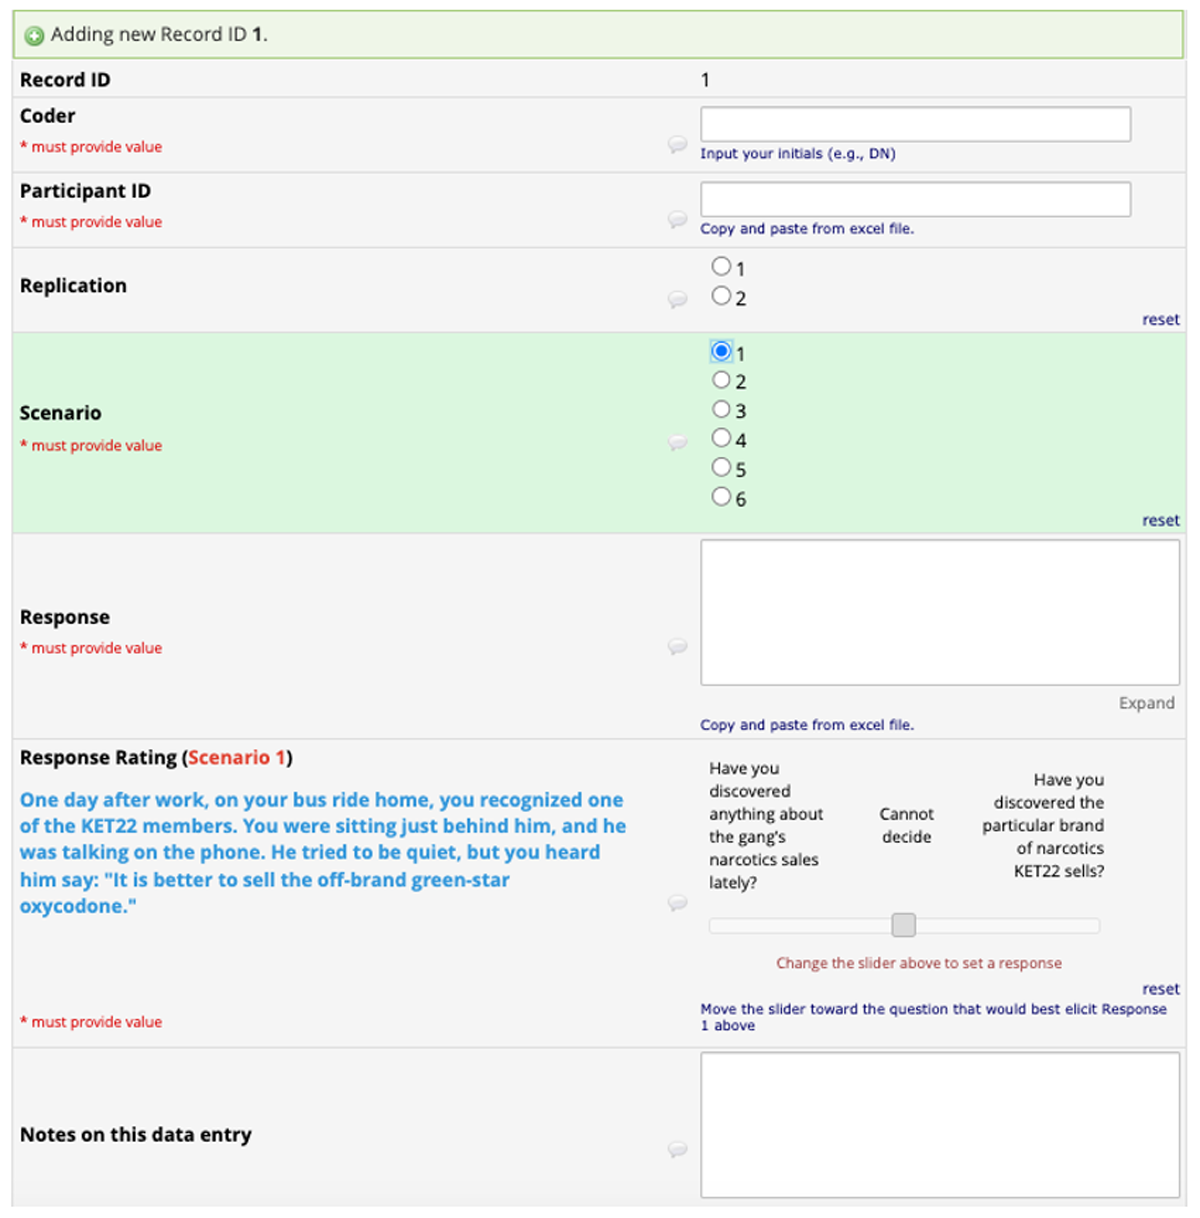
Figure 3
Illustration of codebook.
Table X1
Replication 1: Question Type as a Within-Subjects Factor.
| HYPOTHESIS | MODEL 1A | ANALYSIS | PREDICTIONS |
|---|---|---|---|
| Core Hypothesis 1 High- versus low-specificity questions should elicit more designations of information items that align with pragmatic correspondence | brm(Specificity | trunc(ub = 100, lb = –100) ∼ Disposition + QuType + (QuType | SubjectID) + (Disposition + QuType | Context) Contrast coding for Model 1a: Question-type: high-specificity = 1, low-specificity = –1 Disposition: cooperative = 0 1 resistant. = 1 0 semi-coop. = –1 –1 The model for Replication 1 will only include the two predictors Question Type and Disposition and no interaction term. A model including an interaction term will be run for exploratory purposes. | To test this hypothesis, we investigated whether there is a main effect of question-type on the perceived specificity of participants’ responses. | The Question Type parameter’s HDI should lie outside the ROPE and have a positive sign for high-specificity questions (which are coded as 1). |
| Revision Hypothesis 1a High- versus low-specificity questions do not elicit more designations of information items that align with pragmatic correspondence. | brm(Specificity | trunc(ub = 100, lb = –100) ∼ Disposition + QuType + (QuType | SubjectID) + (Disposition + QuType | Context) Contrast coding for Model 1a: Question-type: high-specificity = 1, low-specificity = –1 Disposition: cooperative = 0 1 resistant. = 1 0 semi-coop. = –1 –1 | To test this hypothesis, we investigated whether there is a main effect of question-type on the perceived specificity of participants’ responses. | The Question Type parameter’s HDI is predicted to fall within the null region, such that we can conclude the data are consistent with ‘no effect’ of question-type (not to say that we have proven that the null hypothesis is true). |
| Core Hypothesis 3 There should be no effect of disposition on preference for pragmatic correspondence. | brm(Specificity | trunc(ub = 100, lb = –100) ∼ Disposition + QuType + (QuType | SubjectID) + (Disposition + QuType | Context) Contrast coding for Model 1a: Question-type: high-specificity = 1, low-specificity = –1 Disposition (treatment): cooperative = 0 0 resistant = 1 0 semi-coop. = 0 1 | To test this hypothesis, we investigated whether there is a main effect of Disposition on the perceived specificity of participants’ responses. | All the Disposition parameter’s HDIs are predicted to fall within the null region, such that we can conclude the data are consistent with ‘no effect’ of disposition (not to say that we have proven that the null hypothesis is true). |
Table X2
Replication 2: Question Type as a Between-Subjects Factor.
| HYPOTHESIS | MODEL 2A | ANALYSIS | PREDICTIONS |
|---|---|---|---|
| Core Hypothesis 1 High-versus low-specificity questions should elicit more designations of information items that align with pragmatic correspondence | brm(Specificity | trunc(ub = 100, lb = –100) ∼ Disposition + QuType + (1 | SubjectID) + (Disposition + QuType | Context) Contrast coding for Model 2a: Question-type: high-specificity = 1, low-specificity = –1 Disposition: cooperative = 0 1 resistant. = 1 0 semi-coop. = –1 –1 The model for Study 2 will only include the two predictors Question Type and Disposition and no interaction term. A model including an interaction term will be run for exploratory purposes. | To test this hypothesis, we investigated whether there is a main effect of question-type on the perceived specificity of participants’ responses. | The Question Type parameter’s HDI should lie outside the ROPE and have a positive sign for high-specificity questions (which are coded as 1). |
| Revision Hypothesis 1a High-versus low-specificity questions do not elicit more designations of information items that align with pragmatic correspondence. | brm(Specificity | trunc(ub = 100, lb = –100) ∼ Disposition + QuType + (QuType | SubjectID) + (Disposition + QuType | Context) Contrast coding for Model 1a: Question-type: high-specificity = 1, low-specificity = –1 Disposition: cooperative = 0 1 resistant. = 1 0 semi-coop. = –1 –1 | To test this hypothesis, we investigated whether there is a main effect of question-type on the perceived specificity of participants’ responses. | The Question Type parameter’s HDI is predicted to fall within the null region, such that we can conclude the data are consistent with ‘no effect’ of question-type (not to say that we have proven that the null hypothesis is true). |
| Core hypotheses 3 There should be no effect of disposition on preference for pragmatic correspondence. | brm(Specificity | trunc(ub = 100, lb = –100) ∼ Disposition + QuType + (QuType | SubjectID) + (Disposition + QuType | Context) Contrast coding for Model 1a: Question-type: high-specificity = 1, low-specificity = –1 Disposition (treatment): cooperative = 0 0 resistant = 1 0 semi-coop. = 0 1 | To test this hypothesis, we investigated whether there is a main effect of disposition on the perceived specificity of participants’ responses. | All the Disposition parameter’s HDIs are predicted to fall within the null region, such that we conclude that the data are consistent with ‘no effect’ of Disposition (not to say that we have proven that the null hypothesis is true). |
Table X3
Investigating Question Type in Interaction with Design Type.
| HYPOTHESIS | MODEL 1A | ANALYSIS | PREDICTIONS |
|---|---|---|---|
| Revision Hypothesis 1b High- versus low-specificity questions manipulated as a between-subjects versus within-subjects factor do not elicit more designations of information items that align with pragmatic correspondence. | brm(Specificity | trunc(ub = 100, lb = –100) ∼ Disposition + QuType + DesignType + QuType:DesignType + (1 | SubjectID) + (Disposition + QuType + DesignType + QuType:DesignType | Context) Contrast coding for Model 3: Question-type: high-specificity = 1, low-specificity = –1 Disposition: cooperative = 0 1 resistant. = 1 0 semi-coop. = –1 –1 Design-type: between = 1 within = –1 | To test this hypothesis, we investigated whether there is an interaction effect of question-type and design-type on the perceived specificity of participants’ responses. | The interaction parameter’s HDI is predicted to fall within the null region, such that we can conclude the data are consistent with ‘no effect’ of question type x design type (not to say that we have proven that the null hypothesis is true). |
Table X3
Replication 1: Confidence Ratings.
| HYPOTHESIS | MODEL 1B (ORDINAL CUMULATIVE MODEL) | ANALYSIS | PREDICTIONS |
|---|---|---|---|
| Core hypotheses 2 High-versus low-specificity question should make participants more confident in their designation choices, independent of disposition. | brm(Confidence ∼ Disposition + QuType + (QuType | SubjectID) + (Disposition + QuType | Context) Contrast coding for Model 1b: Question-type: high-specificity = 1, low-specificity = –1 Disposition (changes to treatment coding to assess disposition, see above): cooperative = 0 1 resistant. = 1 0 semi-coop. = –1 –1 The model included the two predictors Question Type and Disposition and no interaction term. A model including an interaction term was run for exploratory purposes. | To test this hypothesis, we investigated whether there is a main effect of Question Type on the confidence ratings. | The Question Type parameter’s HDI should lie outside the ROPE and have a positive sign for high-specificity questions (which are coded as 1). The Disposition parameter’s HDI is predicted to fall within the null region, such that we conclude that the data are consistent with ‘no effect’ of Disposition on the confidence ratings (not to say that we have proven that the null hypothesis is true). |
[i] Output (5-point Likert Scale): ‘not confident at all,’ ‘slightly confident,’ ‘somewhat confident,’ ‘fairly confident,’ ‘completely confident’.
Table X4
Replication 1: Willingness to Bet (Exploratory).
| HYPOTHESIS | MODEL 1C (ORDINAL CUMULATIVE MODEL) | ANALYSIS | PREDICTIONS |
|---|---|---|---|
| High- versus low-specificity questions should increase the probability of betting, independent of disposition. | brm(Bet ∼ Disposition + QuType + (QuType | SubjectID) + (Disposition + QuType | Context) Contrast coding for Model 1C: Question-type: high-specificity = 1, low-specificity = –1 Disposition (changes to treatment coding to assess disposition, see above): cooperative = 0 1 resistant. = 1 0 semi-coop. = –1 –1 The model included the two predictors Question Type and Disposition and no interaction term. A model including an interaction term was run for exploratory purposes. | To test this hypothesis, we investigated whether there is a main effect of Question Type on the confidence ratings. | The Question Type parameter’s HDI should lie outside the ROPE and should have a positive sign for high-specificity questions (which are coded as 1). The Disposition parameter’s HDI is predicted to fall within the null region, such that we conclude that the data are consistent with ‘no effect’ of Disposition on the confidence ratings (not to say that we have proven that the null hypothesis is true). |
[i] Output: Willingness to bet, ‘yes’ (1), ‘no’ (0).
Table X5
Replication 2: Confidence Ratings.
| HYPOTHESIS | MODEL 2B (ORDINAL CUMULATIVE MODEL) | ANALYSIS | PREDICTIONS |
|---|---|---|---|
| Core hypotheses 2 High- versus low-specificity question should make participants more confident in their designation choices, independent of disposition. | brm(Confidence ∼ Disposition + QuType + (1| SubjectID) + (Disposition + QuType | Context) Contrast coding for Model 2B: Question-type: high-specificity = 1, low-specificity = –1 Disposition (changes to treatment coding to assess disposition, see above): cooperative = 0 1 resistant. = 1 0 semi-coop. = –1 –1 The model included the two predictors Question Type and Disposition and no interaction term. A model including an interaction term was run for exploratory purposes. | To test this hypothesis, we investigated whether there was a main effect of question-type on the perceived specificity of the responses. | The Question Type parameter’s HDI should lie outside the ROPE and have a positive sign for high-specificity questions (which are coded as 1). The Disposition parameter’s HDI is predicted to fall within the null region, such that we conclude that the data are consistent with ‘no effect’ of Disposition on the confidence ratings (not to say that we have proven that the null hypothesis is true). |
[i] Output (5-point Likert Scale): ‘not confident at all,’ ‘slightly confident,’ ‘somewhat confident,’ ‘fairly confident,’ ‘completely confident’.
Table X6
Replication 2: Willingness to bet (exploratory).
| HYPOTHESIS | MODEL 2C (ORDINAL CUMULATIVE MODEL) | ANALYSIS | PREDICTIONS |
|---|---|---|---|
| High- versus low-specificity questions should increase the probability of betting, independent of disposition. | brm(Bet ∼ Disposition + QuType + (1 | SubjectID) + (Disposition + QuType | Context) Contrast coding for Model 2C: Question-type: high-specificity = 1, low-specificity = –1 Disposition (changes to treatment coding to assess disposition, see above): cooperative = 0 1 resistant. = 1 0 semi-coop. = –1 –1 The model included the two predictors Question Type and Disposition and no interaction term. A model including an interaction term was run for exploratory purposes. | To test this hypothesis, we investigated whether there is a main effect of Question Type on the participants’ willingness to bet. | The Question Type parameter’s HDI should lie outside the ROPE and should have a positive sign for high-specificity questions (which are coded as 1). The Disposition parameter’s HDI is predicted to fall within the null region, such that we conclude that the data are consistent with ‘no effect’ of Disposition on the confidence ratings (not to say that we have proven that the null hypothesis is true). |
[i] Output: Willingness to bet, ‘yes’ (1), ‘no’ (0).
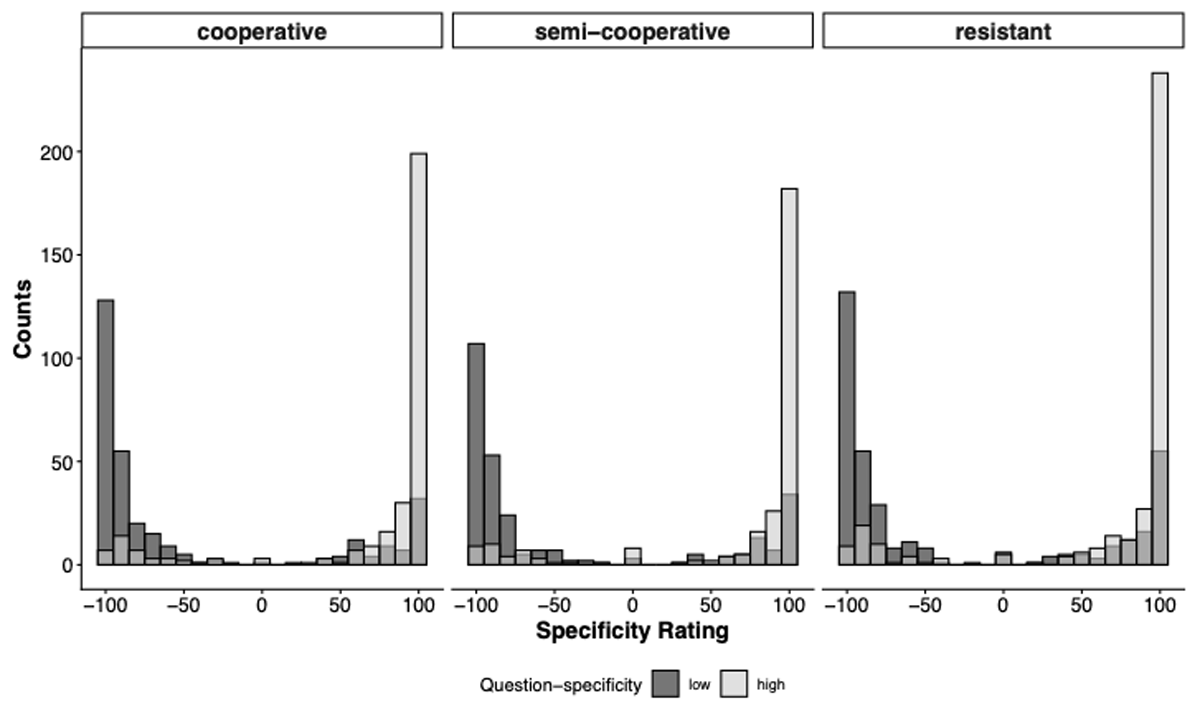
Figure 4
Histograms Showing the Distribution of Specificity Ratings by Question-Specificity Condition and Disposition.
Note. Ratings are binned into 30 equally sized intervals per facet.
Table 1
Population-Level Estimates of Model 1a in Log-Odds with the Standard Errors and 95% Highest Density Intervals.
| PARAMETER | COEFFICIENT | POSTERIOR MEAN | Est. ERROR | l-95% HDI | u-95% HDI |
|---|---|---|---|---|---|
| μ | Intercept | 0.19 | 0.06 | 0.07 | 0.30 |
| μ | Question-Specificity (high) | 0.70 | 0.09 | 0.52 | 0.86 |
| μ | Disposition (cooperative) | –0.02 | 0.05 | –0.12 | 0.09 |
| μ | Disposition (resistant) | 0.04 | 0.06 | –0.07 | 0.15 |
| ϕ | Intercept | –1.66 | 0.03 | –1.72 | –1.61 |
| ϕ | Question-Specificity (high) | 0.11 | 0.03 | 0.06 | 0.16 |
| ϕ | Disposition (cooperative) | 0.01 | 0.03 | –0.05 | 0.08 |
| ϕ | Disposition (resistant) | –0.01 | 0.03 | –0.07 | 0.06 |
[i] Note. Mean parameters are depicted first. The slope for Question-Specificity is the change in log-odds for the high-specificity question (1, high-specificity; –1, low-specificity) and the slope for disposition is the change in log-odds for cooperative and resistant participants (semi-cooperative was coded as –1, –1).
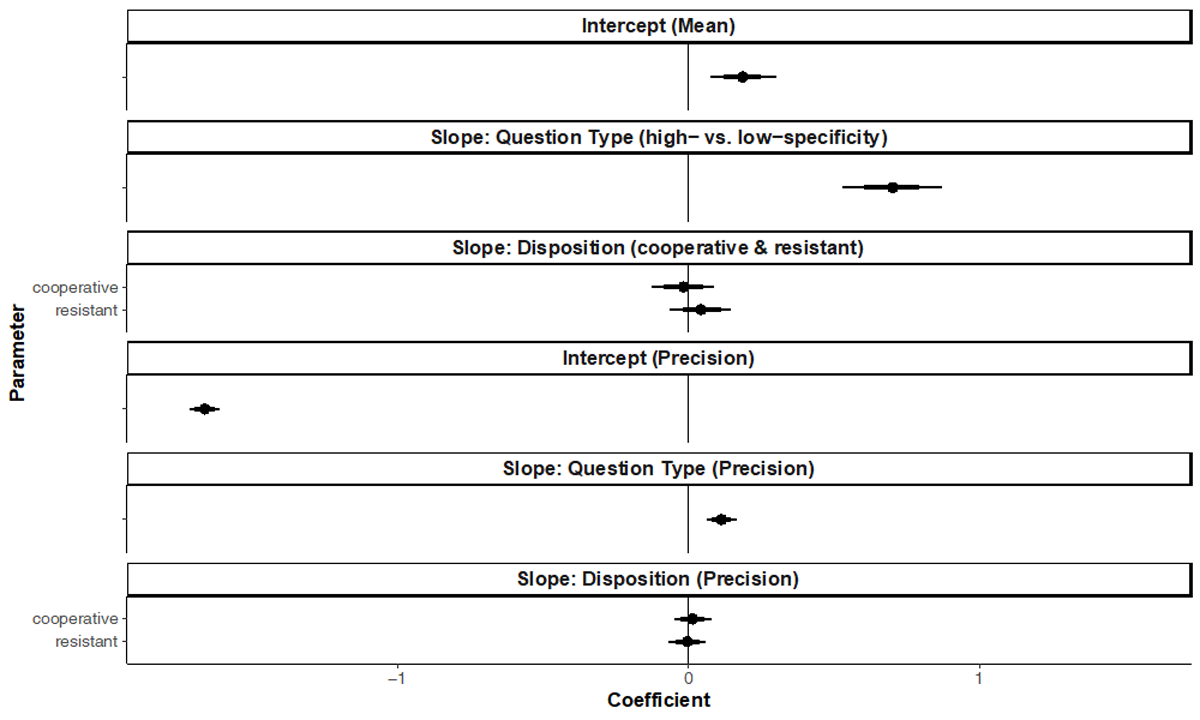
Figure 5
Posterior Distributions over Population-Level Estimates for Model 1a with 80% and 95%.
Note. The highest density intervals and the ROPE area are shaded in light grey.
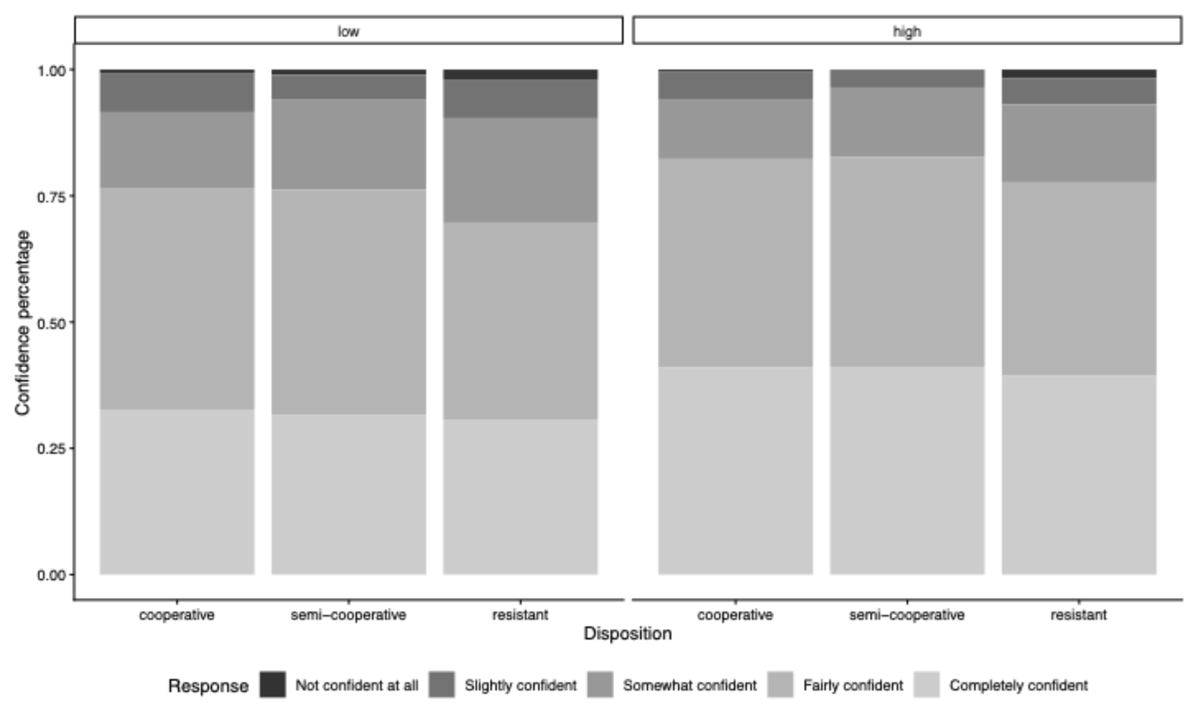
Figure 6
Relative Percentages of Confidence in Information Item Designations (Replication 1).
Note. Distribution of confidence responses by disposition, shown separately for low- and high-specificity questions. Bars represent proportional response frequencies within each Disposition Condition.
Table 2
Population-Level Estimates of Model 1b in Log-Odds with the Standard Errors and 95% Highest Density Intervals.
| COEFFICIENT | POSTERIOR MEAN | Est. ERROR | l-95% HDI | u-95% HDI |
|---|---|---|---|---|
| Intercept [1] | –4.65 | 0.61 | –5.91 | –3.53 |
| Intercept [2] | –2.38 | 0.59 | –3.54 | –1.21 |
| Intercept [3] | –0.27 | 0.60 | –1.51 | 0.83 |
| Intercept [4] | 2.83 | 0.61 | 1.52 | 3.92 |
| Question-Specificity (high) | 0.31 | 0.19 | 0.52 | 0.86 |
| Disposition (cooperative) | 0.07 | 0.22 | –0.12 | 0.09 |
| Disposition (resistant) | –0.19 | 0.20 | –0.07 | 0.15 |
[i] Note. The slope for Question-Specificity is the change in log-odds for the high-specificity question (1, high-specificity; –1, low-specificity) and the slope for disposition is the change in log-odds for cooperative and resistant participants (semi-cooperative was coded as –1, –1).
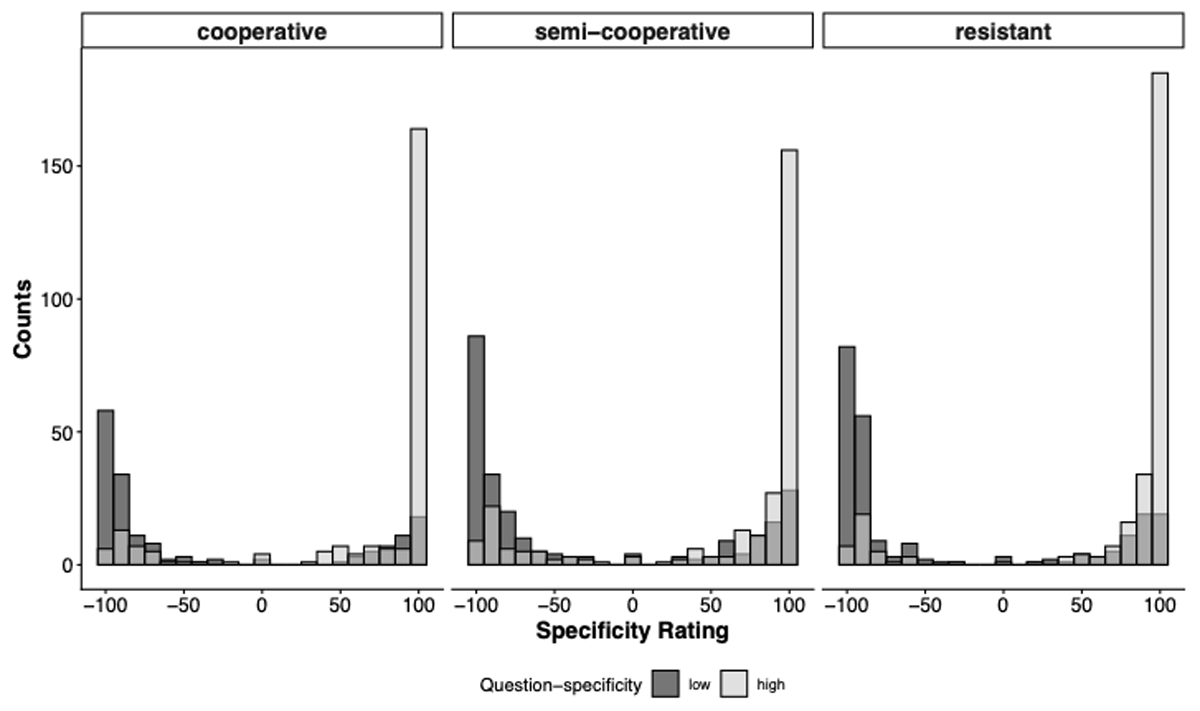
Figure 7
Histograms Showing the Distribution of Specificity Ratings by Question-Specificity Condition and Disposition.
Note. Ratings are binned into 30 equally sized intervals per facet.
Table 3
Population-Level Estimates of Model 2a in Log-Odds with the Standard Errors and 95% Highest Density Intervals.
| PARAMETER | COEFFICIENT | POSTERIOR MEAN | Est. ERROR | l-95% HDI | u-95% HDI |
|---|---|---|---|---|---|
| μ | Intercept | 0.18 | 0.10 | 0.00 | 0.36 |
| μ | Question-Specificity (high) | 0.63 | 0.13 | 0.34 | 0.89 |
| μ | Disposition cooperative | –0.01 | 0.08 | –0.15 | 0.13 |
| μ | Disposition resistant | 0.05 | 0.07 | –0.08 | 0.17 |
| ϕ | Intercept | –1.70 | 0.03 | –1.76 | –1.64 |
| ϕ | Question-Specificity | 0.11 | 0.03 | 0.05 | 0.16 |
| ϕ | Disposition cooperative | –0.00 | 0.04 | –0.08 | 0.08 |
| ϕ | Disposition resistant | 0.03 | 0.04 | –0.05 | 0.10 |
[i] Note. Mean parameters are depicted first. The slope for Question-Specificity is the change in log-odds for the high-specificity question (1, high-specificity; –1, low-specificity), and the slope for Disposition is the change in log-odds for cooperative and resistant participants (semi-cooperative was coded as –1, –1).
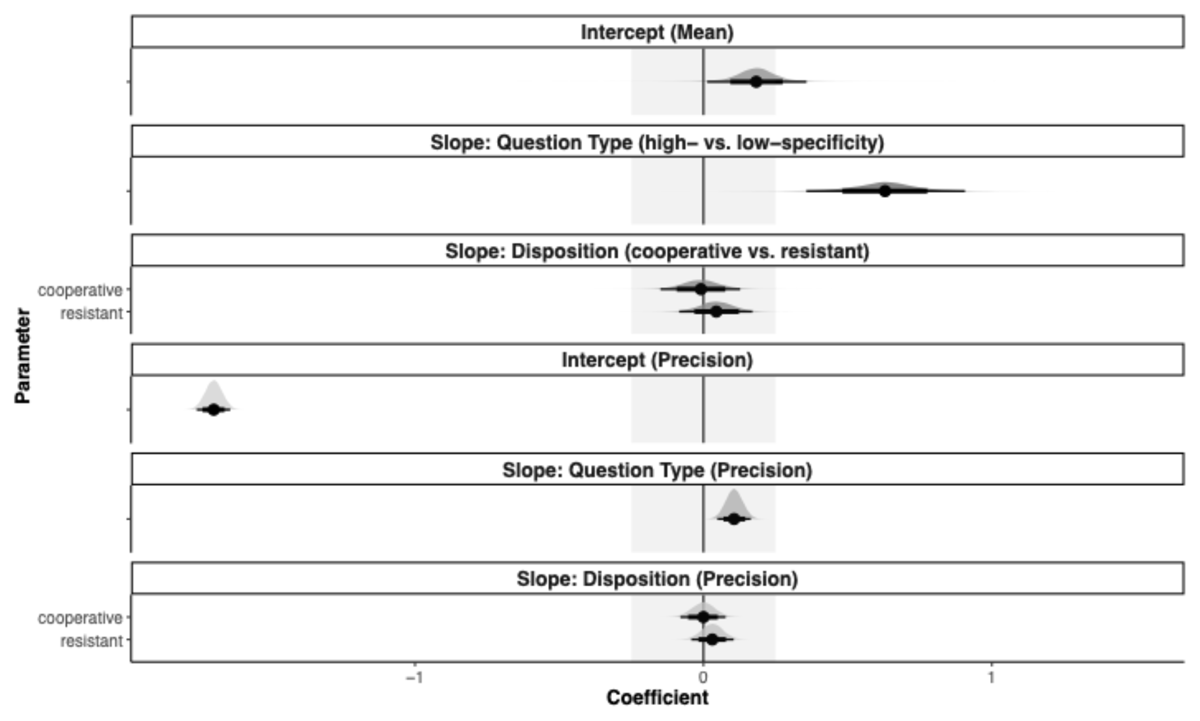
Figure 8
Posterior Distributions Over Population-Level Estimates for Model 2a with 80% and 95%.
Note. The highest density intervals and the ROPE area are shaded in light grey.
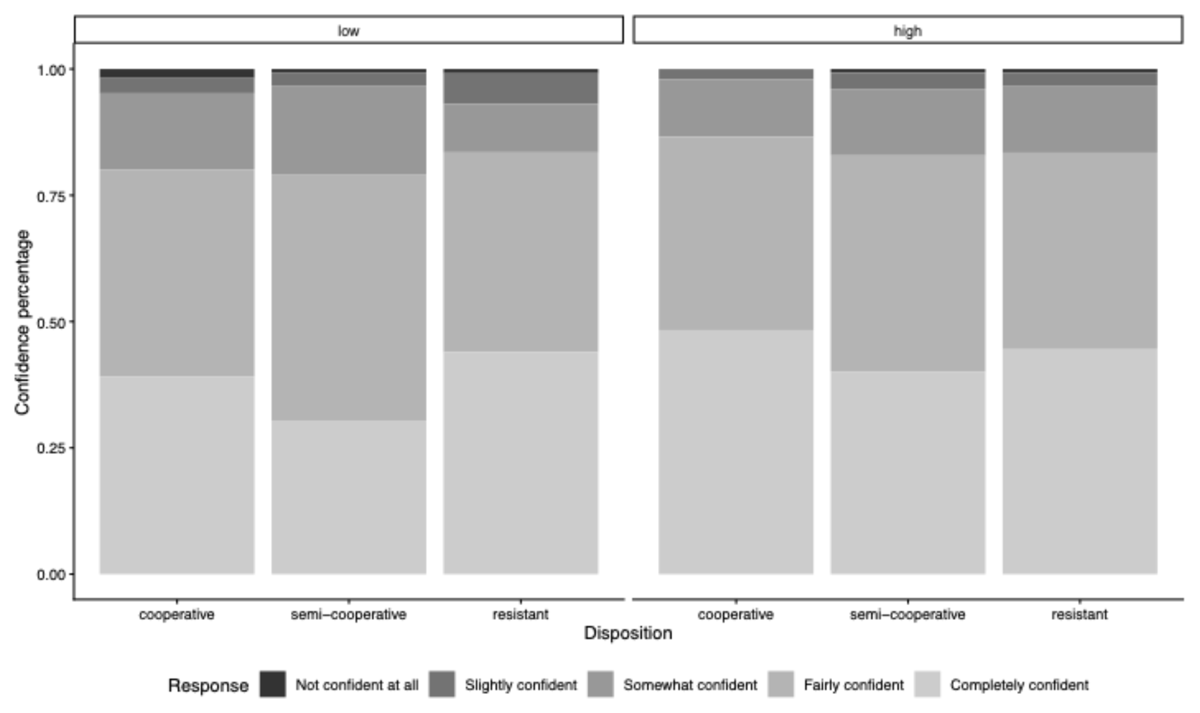
Figure 9
Relative Percentages of Confidence in Information Item Designations (Replication 2).
Note. Distribution of confidence responses by disposition, shown separately for low- and high-specificity questions. Bars represent proportional response frequencies within each Disposition Condition.
Table 4
Population-Level Estimates of Model 2b in Log-Odds with the Standard Errors and 95% Highest Density Intervals.
| COEFFICIENT | POSTERIOR MEAN | Est. ERROR | l-95% HDI | u-95% HDI |
|---|---|---|---|---|
| Intercept [1] | –4.00 | 0.56 | –5.09 | –2.89 |
| Intercept [2] | –2.26 | 0.53 | –3.31 | –1.26 |
| Intercept [3] | –0.09 | 0.53 | –1.09 | 0.96 |
| Intercept [4] | 3.23 | 0.54 | 2.19 | 4.30 |
| Question-Specificity (high) | 0.26 | 0.21 | –0.16 | 0.67 |
| Disposition (cooperative) | 0.13 | 0.25 | –0.39 | 0.60 |
| Disposition (resistant) | 0.13 | 0.25 | –0.38 | 0.61 |
[i] Note. The slope for Question-Specificity is the change in log-odds for the high-specificity question (1, high-specificity; –1, low-specificity) and the slope for disposition is the change in log-odds for cooperative and resistant participants (semi-cooperative was coded as –1, –1).