
Table 1
Outline of Salient Events Taking Place in the Periods Studied.
| Year | Period Considered | Salient Event | Notes |
|---|---|---|---|
| 2007 | 31 Jan to 14 March | New Century, a leading subprime mortgage lender, files for bankruptcy. | The financial crisis becomes palpable. |
| 2007 week 1 and 2007 week 2 | 11–17 June to 13–19 Aug | RANDOM | |
| 2008a | 6 Apr to 20 May | 13–14 April: political elections. | Berlusconi government takes office (8 May). |
| 2008b | 8 Sept to 22 Oct | Lehman Brothers files bankruptcy (15 Sept). | The crisis begins to appear in the Italian media. |
| 2008 week 1 and 2008 week 2 | 24–30 March and 18–24 Aug | RANDOM | |
| 2009 | 24 Sept to 8 Nov | GDP shows signs of recovery. | |
| 2009 week 1 and 2009 week 2 | 2–8 March to 25–31 May | RANDOM | |
| 2010 | 25 March to 8 May | The crisis explodes in Greece. | The first country in the Eurozone enters the acute phase of the crisis, drawing quite a bit of media attention. |
| 2010 week 1 and 2010 week 2 | 15–21 Feb to 17–23 May | RANDOM | |
| 2011a | 24 June to 8 Aug | This is the most acute phase of sovereign debt in Italy. | |
| 2011b | 5 Nov to 19 Dec | Berlusconi resigns (12 Nov). | The Monti government takes office (16 Nov). |
| 2011 vweek 1 and 2011 week 2 | 14–20 Feb to 10–16 Oct | RANDOM | |
| 2012 | 25 Jan to 8 March 2012 | The spread decreases. | European cooperation occurs. |
| 2012 week 1 and 2012 week 2 | 28 May to 3 June and 10–16 Dec | RANDOM | |
| 2013 | 17 Feb to 31 March | 24–25 Feb 2013: political elections. | The Letta government takes office (28 April). |
| 2013 week 1 and 2013 week 2 | 28 Jan to 3 Feb and 3–9 June | RANDOM |
[i] Note: The letter next to the year refers to specific periods, as explained in the text.
Table 2
Lexicometric Chatracteristics.
| N – Total occurrences | 188566 |
| V – Different word-types | 23126 |
| (V/N)*100 – Type/Token Ratio | 12.264 |
| (VI/V)*100 – Percentage of hapax | 51.397 |
Table 3
Outline of the Unification of the Periods Analysed.
| Final Outcome | Periods Initially Included |
|---|---|
| 2007N | 2007 + 2007 week 1 |
| 2008AN | 2007 week 2 + 2008 week 1 + 2008a |
| 2008BN | 2008b + 2008 week 2 |
| 2009N | 2009 week 1 + 2009 week 2 + 2009 |
| 2010N | 2010 week 1 + 2010 + 2010 week 2 |
| 2011AN | 2011 week 1 + 2011a |
| 2011BN | 2011b + 2011 week 2 |
| 2012N | 2012 + 2012 week 1 + 2012 week 2 |
| 2013N | 2013 + 2013 week 1 + 2013 week 2 |
Table 4
The Number of Titles Regarding the Crisis Found in the Newspapers Analysed in the Periods Considered.
| Il Corriere della Sera | La Repubblica | Il Giornale | Il Manifesto | Total | |
|---|---|---|---|---|---|
| 2007 | 57 | 81 | 71 | 38 | 247 |
| 2007 week 1 | 3 | 9 | 5 | 3 | 20 |
| 2007 week 2 | 12 | 15 | 13 | 6 | 46 |
| 2008a | 98 | 97 | 37 | 42 | 274 |
| 2008b | 257 | 340 | 158 | 121 | 876 |
| 2008 week 1 | 17 | 10 | 8 | 10 | 45 |
| 2008 week 2 | 14 | 14 | 10 | 5 | 43 |
| 2009 | 170 | 264 | 67 | 77 | 578 |
| 2009 week 1 | 61 | 57 | 27 | 27 | 172 |
| 2009 week 2 | 33 | 54 | 16 | 20 | 123 |
| 2010 | 128 | 274 | 73 | 74 | 549 |
| 2010 week 1 | 31 | 24 | 5 | 15 | 75 |
| 2010 week 2 | 26 | 36 | 21 | 18 | 101 |
| 2011a | 118 | 290 | 58 | 88 | 496 |
| 2011b | 265 | 420 | 97 | 840 | |
| 2011 week 1 | 20 | 35 | 4 | 7 | 66 |
| 2011 week 2 | 37 | 76 | 12 | 21 | 146 |
| 2012 | 179 | 324 | 77 | 63 | 643 |
| 2012 week 1 | 42 | 61 | 15 | 7 | 125 |
| 2012 week 2 | 27 | 71 | 16 | 11 | 125 |
| 2013 | 163 | 407 | 51 | 53 | 674 |
| 2013 week 1 | 21 | 59 | 12 | 13 | 105 |
| 2013 week 2 | 25 | 61 | 12 | 4 | 102 |
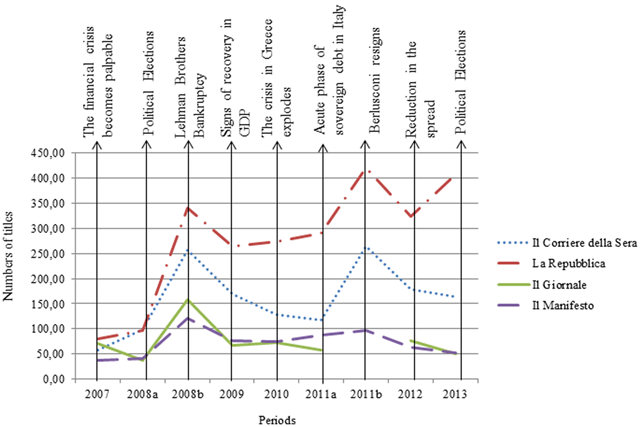
Figure 1
The Number of Titles Containing the Word “Crisis” Appearing in the Different Newspapers at the Times of Specific Events.
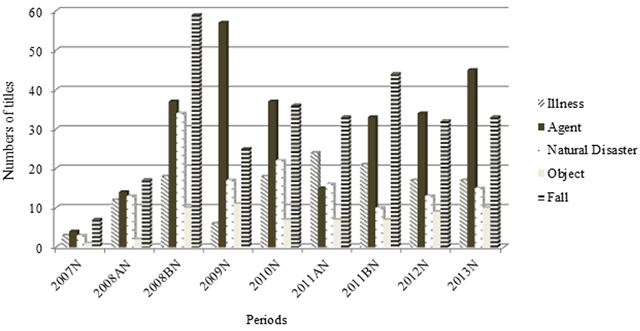
Figure 2
The Use of Metaphors During the Period Studied.
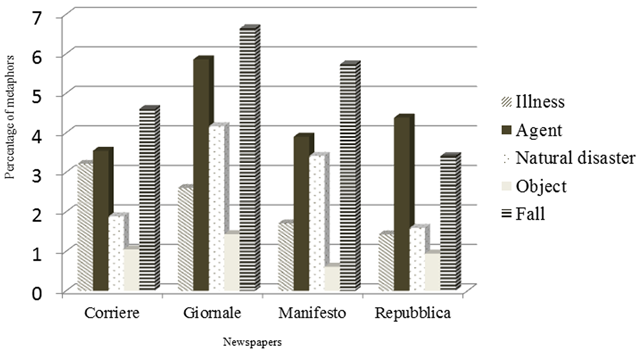
Figure 3
The Use of Metaphors in the Four Newspapers Studied.