
Table 1
Descriptions and characteristics of the four regions based on a national database [29] and information received from the regions. *Regional joint health and social care authority.
| REGION | A | B | C | D |
|---|---|---|---|---|
| Short description | Smallest and most rural population base | Most urban, densely populated area | Rural region with ageing population | Mixed urban–rural region |
| Home care coverage among 75-year-olds (%) | 15.1 | 11.3 | 12.7 | 13.4 |
| Home care clients (% of total population) | 2.7 | 1.3 | 2.2 | 2.0 |
| Integration prior to the 2023 reform?* | Yes | No | Yes | No |
| Home care employees | < 500 | > 1500 | 500–999 | 1000–1500 |
| EHR interoperability | Interoperable; Health and social care on same system | Not interoperable; multiple systems used without integration | Partially interoperable; health and social care are on different modules | Not interoperable; multiple systems used without integration |
| Care coordination structures | Unified care coordination protocols across region | Some standardised care pathways but not used across region | Some standardised care pathways but not used across region | Some standardised care pathways but not used across region |
| Estimated integrated care maturity | High – Shared EHRs and multiple joint practices in place | Moderate/Low – Functional integration developing, but not uniform | Moderate – Structural separation hinders integration | Low – Vertical integration largely absent |
Table 2
Description of respondents’ characteristics and variables.
| VARIABLE | REGION A n (%) | REGION B n (%) | REGION C n (%) | REGION D n (%) | TOTAL n (%) |
|---|---|---|---|---|---|
| Respondents | 96 | 142 | 146 | 241 | 625 |
| Profession | |||||
| Practical nurse | 76 (79.2) | 85 (59.9) | 104 (71.2) | 156 (64.7) | 421 (67.4) |
| Registered nurse | 16 (16.7) | 34 (23.9) | 25 (17.1) | 49 (20.3) | 124 (19.8) |
| Physician | 1 (1.0) | 6 (4.2) | 3 (2.1) | 9 (3.7) | 19 (3.0) |
| Therapist | 1 (1.0) | 7 (4.9) | 1 (0.7) | 3 (1.2) | 12 (1.9) |
| Other | 2 (2.1) | 10 (7.0) | 13 (8.9) | 24 (10.0) | 49 (7.8) |
| Age | |||||
| <30 | 16 (16.7) | 19 (13.4) | 22 (15.1) | 38 (15.8) | 95 (15.2) |
| 30–39 | 19 (19.8) | 34 (23.9) | 30 (20.5) | 64 (26.6) | 147 (23.5) |
| 40–49 | 24 (25.0) | 37 (26.1) | 37 (25.3) | 56 (23.2) | 154 (24.6) |
| 50–59 | 30 (31.3) | 46 (32.4) | 37 (25.3) | 56 (23.2) | 169 (27.0) |
| ≥60 | 7 (7.3) | 6 (4.2) | 20 (13.7) | 27 (11.2) | 60 (9.6) |
| Gender | |||||
| Women | 85 (88.5) | 128 (90.1) | 139 (95.2) | 216 (89.6) | 568 (90.9) |
| Men | 10 (10.4) | 11 (7.7) | 6 (4.1) | 19 (7.9) | 46 (7.4) |
| Other and NA | 1 (1.0) | 3 (2.1) | 1 (0.7) | 6 (2.5) | 11 (1.8) |
| Years of experience | |||||
| <5 | 21 (21.9) | 30 (21.1) | 21 (14.4) | 42 (17.4) | 114 (18.2) |
| 5–9 | 24 (25.0) | 29 (20.4) | 38 (26.0) | 48 (19.9) | 139 (22.2) |
| 10–14 | 14 (14.6) | 25 (17.6) | 29 (19.9) | 49 (20.3) | 117 (18.7) |
| 15–19 | 5 (5.2) | 17 (12.0) | 16 (11.0) | 25 (10.4) | 63 (10.1) |
| 20–24 | 12 (12.5) | 18 (12.7) | 11 (7.5) | 30 (12.4) | 71 (11.4) |
| ≥25 | 20 (20.8) | 23 (16.2) | 31 (21.2) | 47 (19.5) | 121 (19.4) |
| Role-related status | |||||
| Full-time employment (Yes) | 88 (91.7) | 127 (89.4) | 135 (92.5) | 217 (90.0) | 567 (90.7) |
| Supervisory role (Yes) | 6 (6.3) | 10 (7.0) | 18 (12.3) | 10 (4.1) | 44 (7.0) |
| Direct care (Yes) | 81 (84.4) | 124 (87.3) | 131 (89.7) | 228 (94.6) | 564 (90.2) |
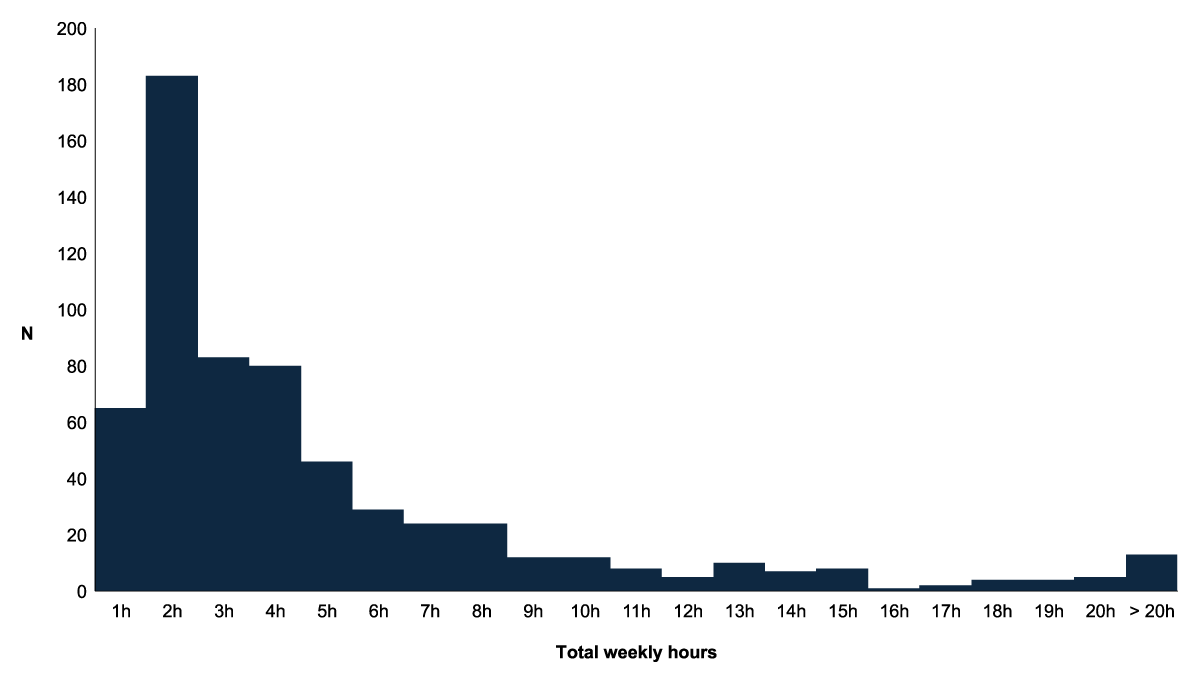
Figure 1
Distribution of total weekly time spent on health information management. N = 625. Responses exceeding 20 hours (n = 13) were aggregated for visualization because of the relatively low number of such responses.
Table 3
Weekly average time spent on health information management for each task by profession.
| TASK | PRACTICAL NURSE (n = 421) | REGISTERED NURSE (n = 124) | PHYSICIAN (n = 19) | THERAPIST (n = 12) | OTHER (n = 49) | |||||
|---|---|---|---|---|---|---|---|---|---|---|
| MEAN (±SD) | % OF TOTAL | MEAN (±SD) | % OF TOTAL | MEAN (±SD) | % OF TOTAL | MEAN (±SD) | % OF TOTAL | MEAN (±SD) | % OF TOTAL | |
| Q1. Retrieving information | 60 (66) | 32.2 | 137 (99) | 25.7 | 164 (111) | 46.5 | 108 (84) | 32 | 65 (79) | 32.7 |
| Q2. Care coordination | 35 (45) | 18.6 | 117 (89) | 22 | 44 (41) | 12.5 | 90 (78) | 26.7 | 37 (47) | 18.6 |
| Q3. Contacting clients | 30 (42) | 16 | 93 (77) | 17.5 | 58 (84) | 16.3 | 40 (27) | 11.9 | 34 (53) | 17.1 |
| Q4. Responding to client contact | 31 (40) | 16.6 | 92 (80) | 17.3 | 40 (59) | 11.3 | 54 (81) | 16 | 34 (51) | 17.1 |
| Q5. Inter-professional communication | 31 (46) | 16.7 | 93 (86) | 17.4 | 48 (86) | 13.5 | 45 (46) | 13.4 | 29 (43) | 14.6 |
| Average total minutes | 185 (195) | 518 (373) | 336 (271) | 310 (208) | 182 (224) | |||||
| Average total; h, minutes | 3 h 5 min | 8 h 38 min | 5 h 36 min | 5 h 10 min | 3 h 2 min | |||||
[i] N = 625. The average total was calculated by summing answers from Q1 to Q5; thus, it differs from the sum of the averages of each question. Missing values (answer option not applicable) for the questions are as follows: Q1 = 6, Q2 = 39, Q3 = 11, Q4 = 6, Q5 = 18. The full-length items are presented in Supplementary file 4.
Table 4
Descriptive statistics (mean and standard deviation), univariate analysis of variance (ANOVA), and multiple linear regression model results including 95% confidence intervals (CI) of weekly health information management time use.
| VARIABLE | MEAN (SD) | UNIVARIATE p-VALUE, ANOVA | COEFFICIENT β, REG. MODEL | 95% CI, REG. MODEL | pr(>|t|), REG. MODEL* |
|---|---|---|---|---|---|
| Intercept (reference) | 510.73 | 446; 576 | <0.001* | ||
| Profession | <0.001* | ||||
| Registered nurse (reference) | 518 (373) | ||||
| Practical nurse | 185 (195) | –333.65 | –383; –284 | <0.001* | |
| Physician | 336 (271) | –184.95 | –303; –67 | 0.002* | |
| Therapist | 310 (208) | –210.10 | –356; –64 | 0.005* | |
| Other personnel | 182 (224) | –331.65 | –413; –250 | <0.001* | |
| Region | 0.282 | ||||
| A (reference) | 222 (279) | ||||
| B | 285 (293) | 27.59 | –37; 92 | 0.399 | |
| C | 221 (239) | –7.52 | –71; 56 | 0.16 | |
| D | 278 (289) | 33.30 | –26; 92 | 0.267 | |
| Direct client care | 0.041* | ||||
| Direct client care (Yes) (reference) | 262 (287) | ||||
| Direct client care (No) | 218 (176) | –69.51 | –135; –4 | 0.038* | |
| Full-time employment | 0.316 | ||||
| Full-time employment (Yes) (reference) | 262 (279) | ||||
| Full-time employment (No) | 220 (266) | –34.05 | –101; 33 | 0.316 |
[i] *Pr(>|t|) denotes the two-tailed p-value for a t-test under the null hypothesis that the coefficient is zero. Values in the table represent the mean total weekly HIM time (in minutes) for each subgroup independently, regardless of other variables. Adjusted R² = 0.229, non-adjusted R² = 0.241. Degrees of freedom = 615. P value = 2.2 × 10⁻¹⁶. Degrees of freedom = 615. P value = 2.2 × 10⁻¹⁶.