
Table 1
DCE stages, critical steps we experienced, and how participatory research helped us address them.
| DCE PHASE (REED JOHNSON ET AL., 2013) | CRITICAL STEPS WE EXPERIENCED | HOW PARTICIPATORY RESEARCH HELPED US ADDRESS THEM |
|---|---|---|
| 1. Attribute & level development | Identify relevant attributes and define realistic levels. | Previous OOHC research informed the initial selection. Workshops/webinars with service providers (Local Government Association, LGA, charities). Key: PPI stakeholder consultation on attributes and levels. |
| 2. Questionnaire design | Develop a clear, accessible questionnaire; ensure understandable choice tasks. | PPI stakeholder input on presentation, wording, and format. PPI review of drafts, feedback on clarity, and layout. Cognitive interviewing. Pilot testing (n = 88). |
| 3. Data collection | Recruit a representative sample; administer effectively; provide support. | Individuals with lived experience recruited from 10 sites (n = 300 enrolled, 112 collected and 108 suitable for analyses). Trained peer researchers supported respondents. Paper questionnaires. |
| 4. Data analysis & interpretation | Analyse data; interpret results; and translate findings into recommendations. | PPPIE stakeholder involvement in interpretation. PEH consultation on translating findings into recommendations. |
| 5. Presentation & insights derivation | Effectively communicate findings; derive actionable insights. | Interactive dashboards (co-created with all PPPIE stakeholders). Videos and website for communication. Workshops to present findings, demonstrate visualisations, and inform decision-making. Iterative dashboard refinement. |
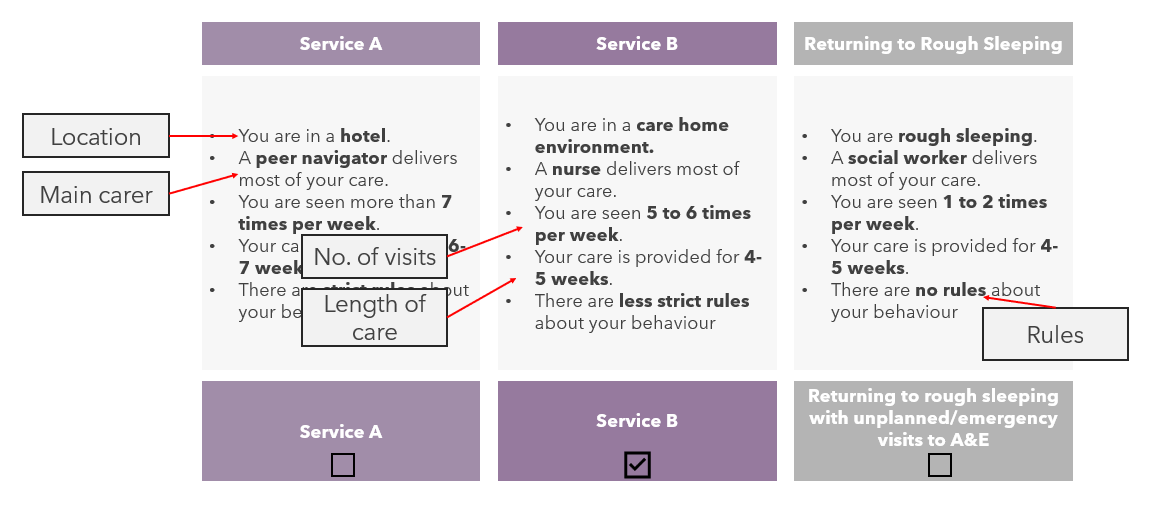
Figure 1
Example of DCE choice.
Note: the list of service characteristics (attributes) and corresponding values (or levels) is presented in Appendix 1.
Table 2
Respondents’ characteristics (n = 108).
| MEAN | SD | |
|---|---|---|
| Age | 49 | 12 |
| % | Number | |
| Age categories | ||
| 20–24 | 5 | 5 |
| 25–29 | 6 | 6 |
| 30–34 | 5 | 5 |
| 35–39 | 12 | 13 |
| 40–44 | 13 | 14 |
| 45–49 | 12 | 13 |
| 50–54 | 12 | 13 |
| 55–59 | 14 | 15 |
| 60–64 | 15 | 16 |
| 65–69 | 4 | 4 |
| 70–74 | 1 | 1 |
| 75–80 | 1 | 1 |
| Gender* | ||
| Male | 69 | 73 |
| Female | 31 | 35 |
| Service received | ||
| Pathway 1 | 56 | 60 |
| Pathway 2 | 44 | 48 |
[i] Note: Pathway 1 refers to “Take home and settle-in” support, commonly defined as Reablement, a short-term intervention aiming to help individuals regain independence at home following a hospital stay. Pathway 2 involves access to specialist bedded intermediate care or step-down housing, providing structured support for those who are not yet able to return home safely but do not require acute hospital care.
*Please note that nobody identified their gender in any other way.
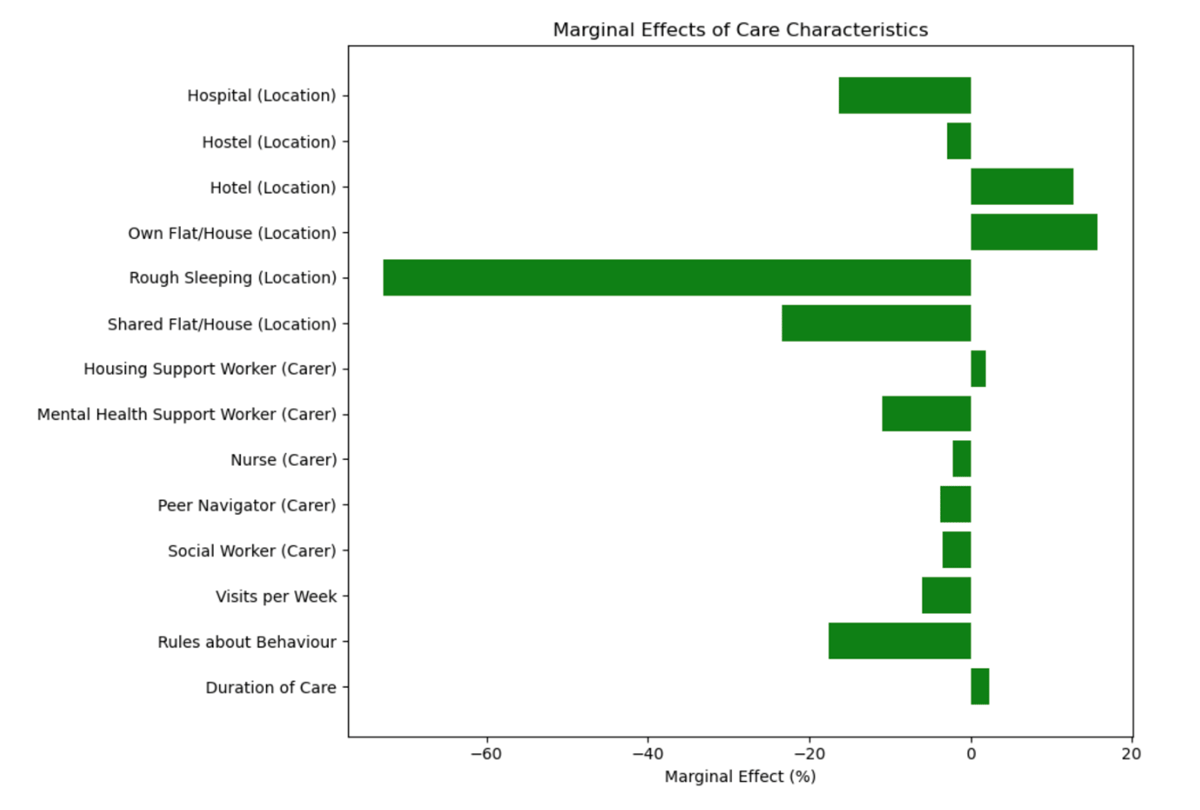
Figure 2
Relative importance of intermediate care characteristics.
Note: This figure displays the marginal effects (%) of different intermediate care characteristics on individuals’ choices, derived from a DCE. These marginal effects quantify the relative importance of each attribute when PEH select a model of OOHC. For example, when looking at location: Rough Sleeping has the strongest negative marginal effect (~ –60%), indicating a very strong preference against this option; Own Flat/House is the most preferred location, showing the highest positive marginal effect (~ +20%).