
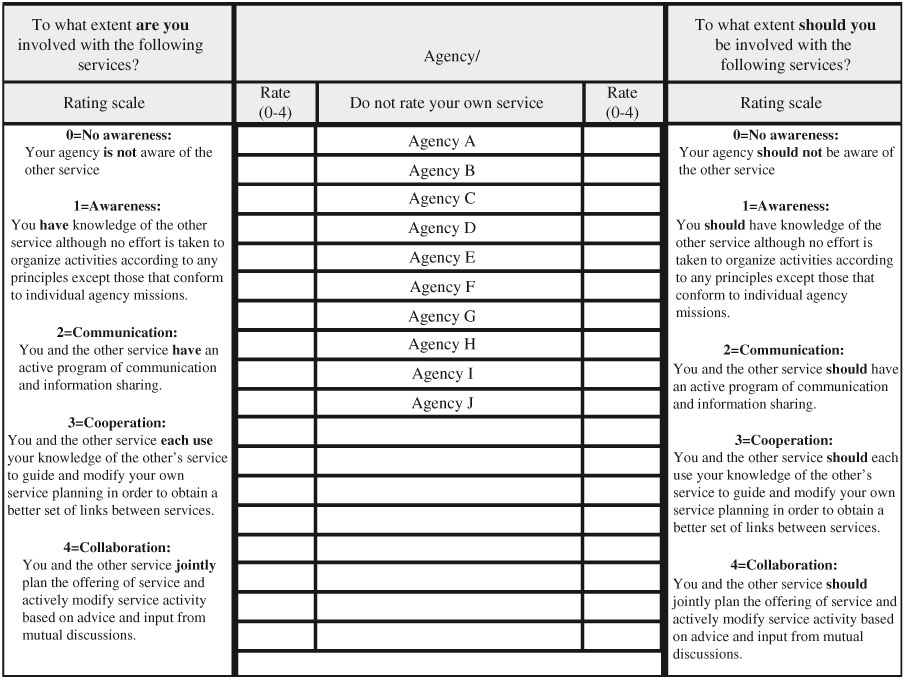
Figure 1.
The Human Service Integration Measure Scale.
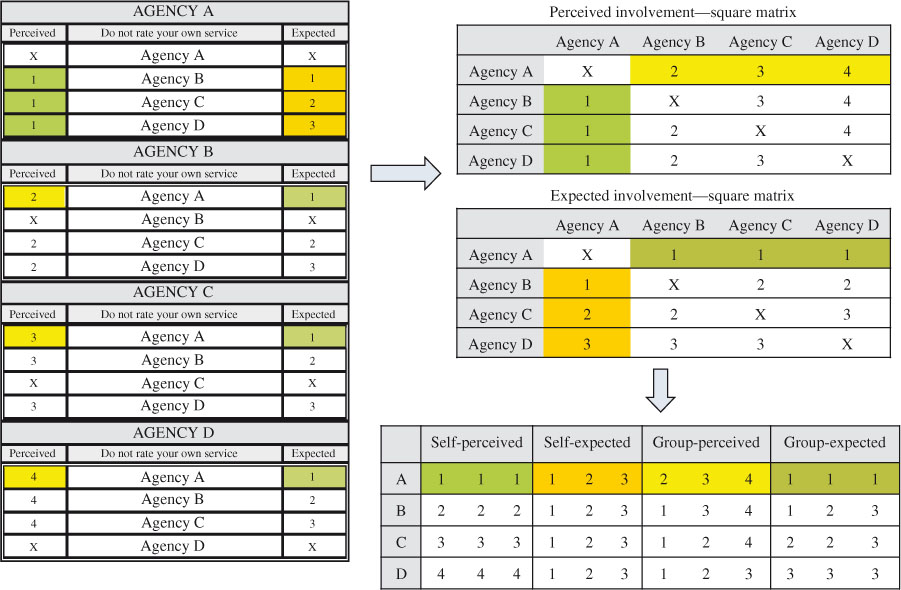
Figure 2.
An example for organizing the data.
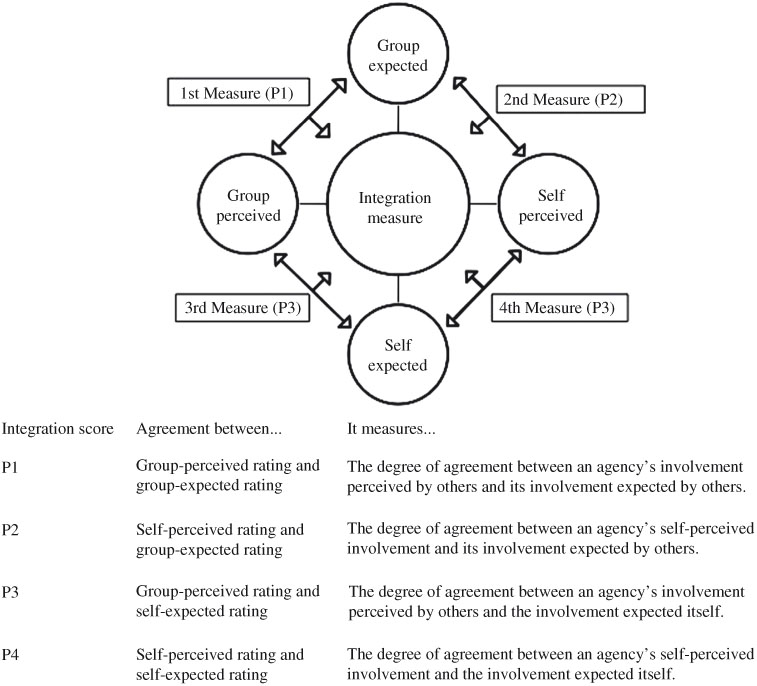
Figure 3.
The framework of measuring integration.
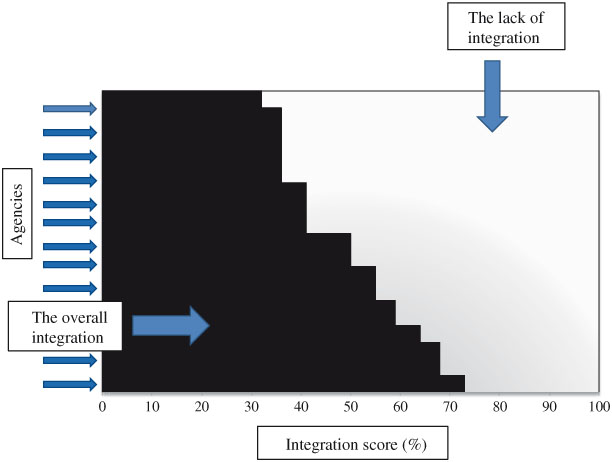
Figure 4.
An example of the global integration.
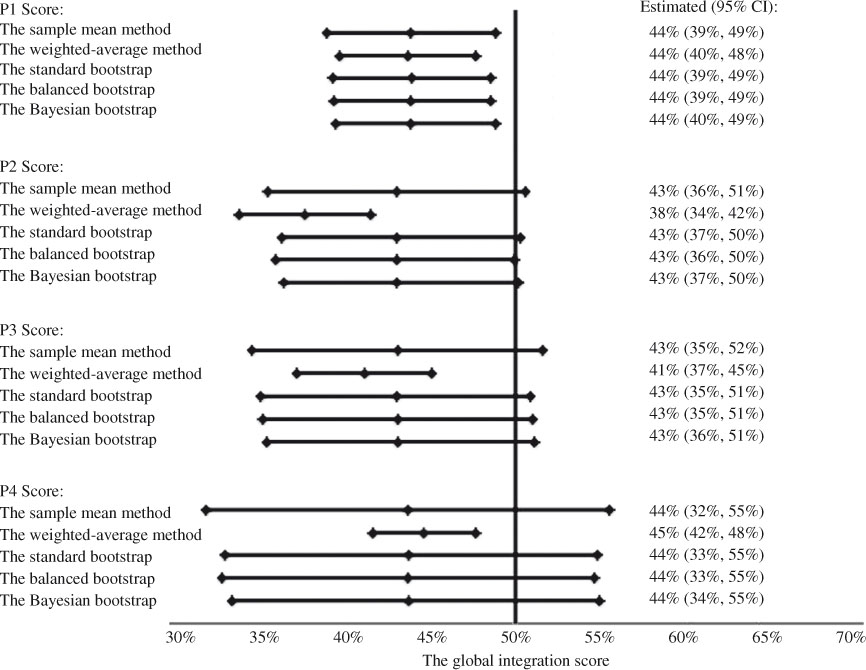
Figure 5.
Global integration scores of CTN Simcoe.
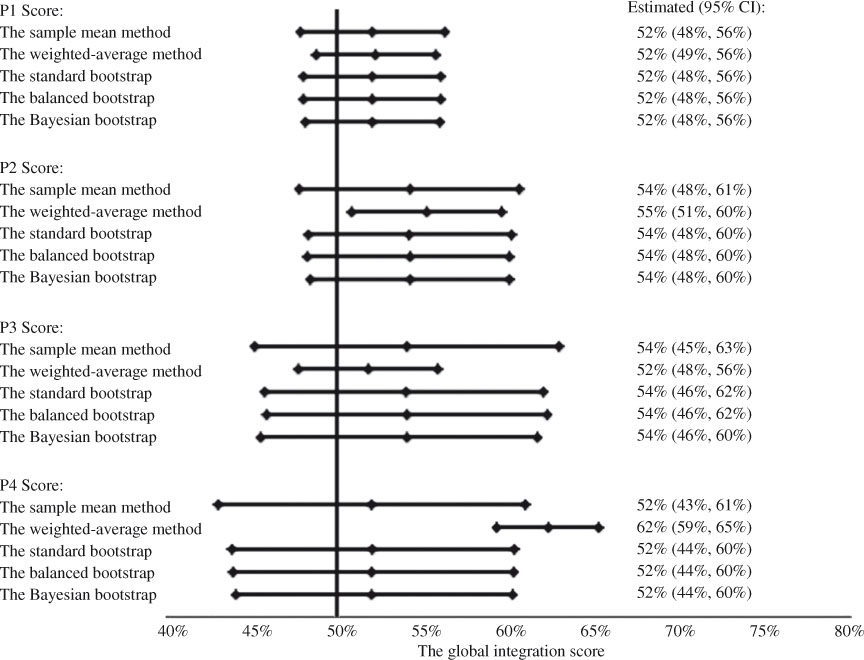
Figure 6.
Global integration scores of CTN York.
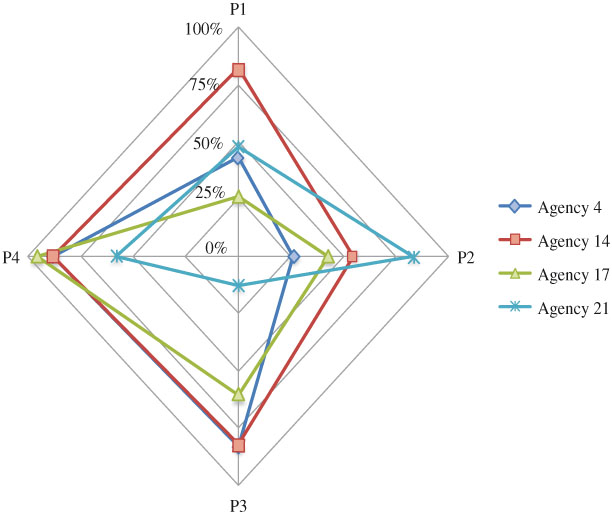
Figure 7.
The spider plot for comparing the 4 integration scores for agencies in Simcoe.
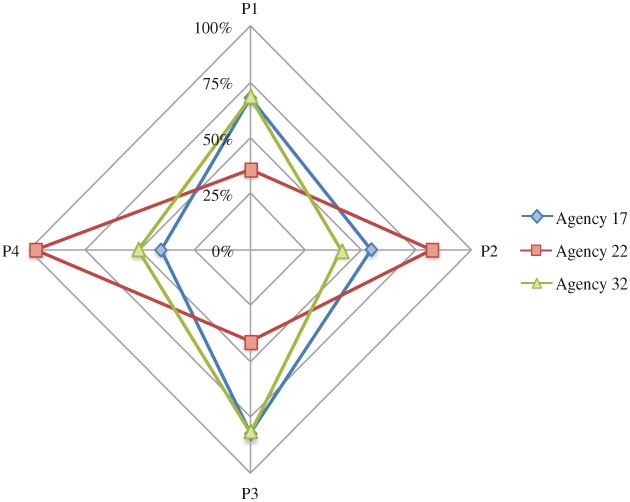
Figure 8.
The spider plot for comparing the 4 integration scores for agencies in York.
Table 1.
Integration scores for the agencies of the Children’s Treatment Network (CTN)
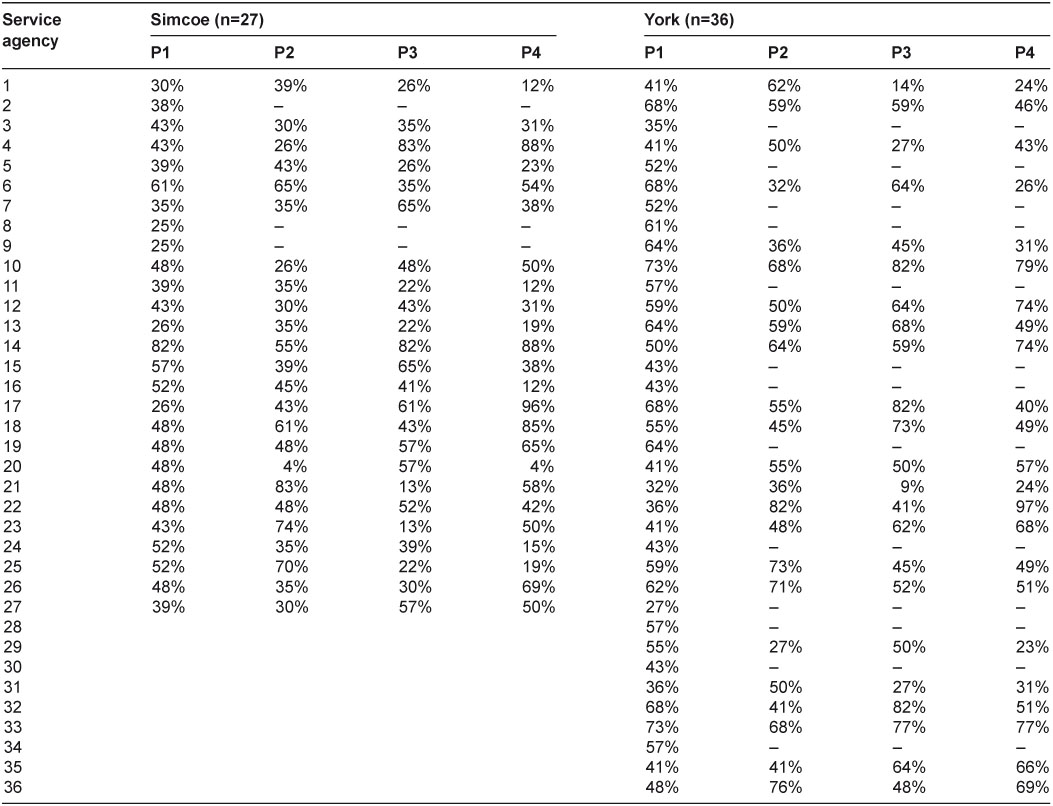
Percentages were rounded up to integer; the agencies were listed in a consecutive order and the same number did not refer to the same agency; CI=confidence interval.
P1=the degree of agreement between an agency’s involvement perceived by others and its involvement expected by others.
P2=the degree of agreement between an agency’s self-perceived involvement and its involvement expected by others.
P3=the degree of agreement between an agency’s involvement perceived by others and the involvement expected itself.
P4=the degree of agreement between an agency’s self-perceived involvement and the involvement expected itself.
Table 2.
Global integration scores estimated by different methods
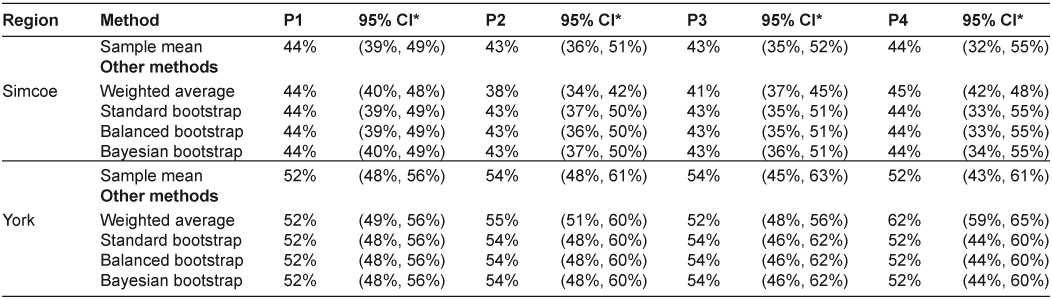
*CI=confidence interval, a credibility interval was calculated instead in the Bayesian bootstrap method; n=number of respondents; bootstrap estimates were obtained by simulating 40,000 bootstrap samples.
P1=the degree of agreement between an agency’s involvement perceived by others and its involvement expected by others.
P2=the degree of agreement between an agency’s self-perceived involvement and its involvement expected by others.
P3=the degree of agreement between an agency’s involvement perceived by others and the involvement expected itself.
P4=the degree of agreement between an agency’s self-perceived involvement and the involvement expected itself!