
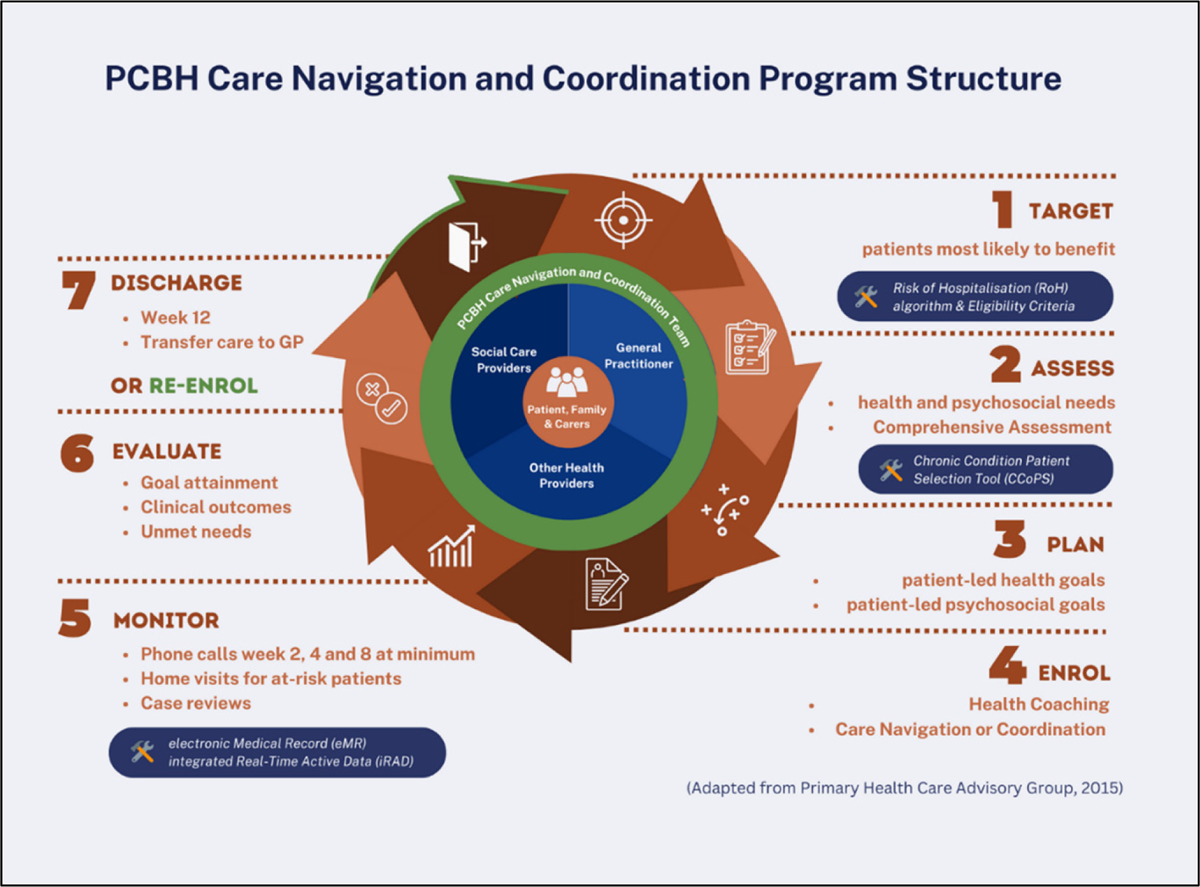
Figure 1
Planned Care for Better Health care navigation and coordination program structure.
Table 1
Eligibility criteria for PCBH enrolment and exclusion criteria.
Eligibility:
Exclusion criteria:
The rationale of the exclusion criteria is that there are current care navigation and coordination services available for these population, for example the SWSLHD Aboriginal Chronic Care Program, and inpatient services from hospital, residential aged care, group home or correctional facility. |
Table 2
Items included in patient assessments in week 1 and week 12 of intervention.
| Comprehensive health and psychological assessments are completed using the NSW CCoPS tool, which assess the patient’s risk profile in the following domains. 1.Diagnosis or clinical symptoms of chronic conditions 2.Service access profile a.Hospital use in the past 12 months b.GP checks at least twice in the past 12 months c.Reduced ability to self-care impacting on disease management 3.Risk factors: a.Smoking b.Overweight/underweight c.Hypercholesterolaemia d.Hypertension e.Physical inactivity f.Polypharmacy 4.Potentially extenuating factors: a.Use of community-based services previously b.Carer stress issue c.No carer d.Cognitive impairment e.Recent change to drug regimen f.Chronic pain g.Compromised skin integrity h.Exposure to triggers for asthma 5.Patient self-reported health status 6.Psycho-social and demographic factors a.Mental health issues b.Disability c.Difficulty accessing transport to services d.Financial issues e.Aboriginal or Torres Strait Islander status f.Culturally and linguistically diverse g.Illiteracy and/or limited English h.Unstable living environment i.Social isolation j.Drug and/or alcohol problems k.Impact rating on self-management ability 7.Patient’s readiness to change. |
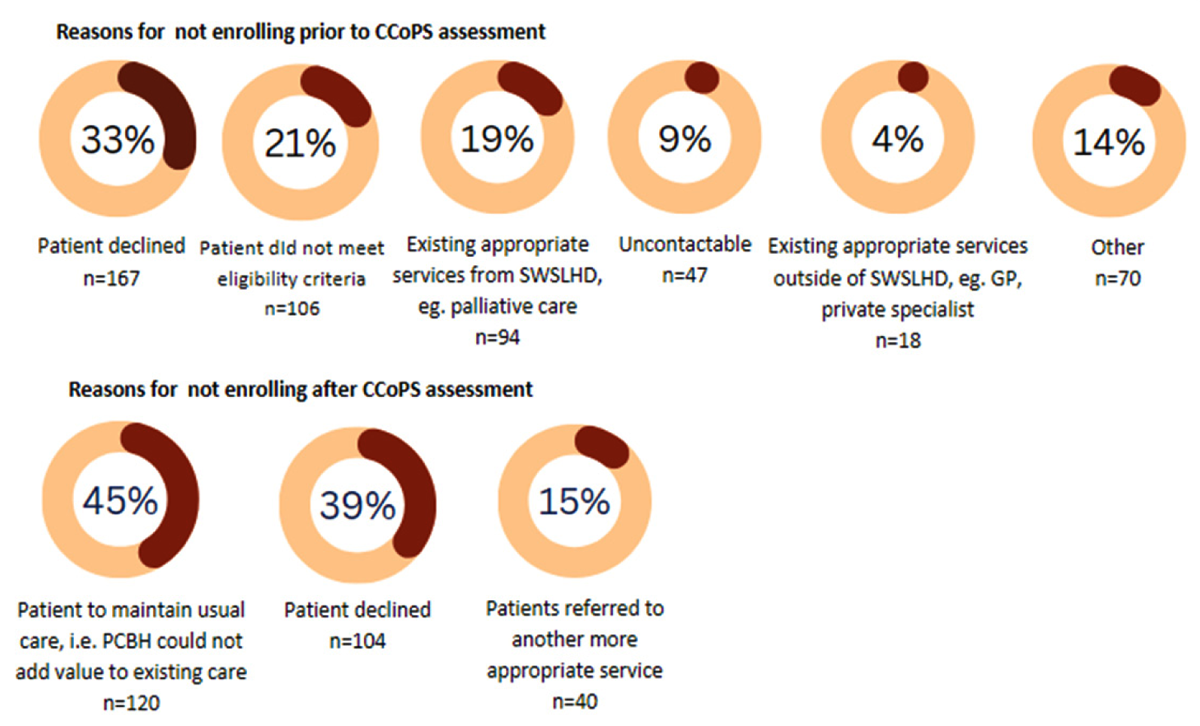
Figure 2
Reasons for not enrolling into PCBH program.
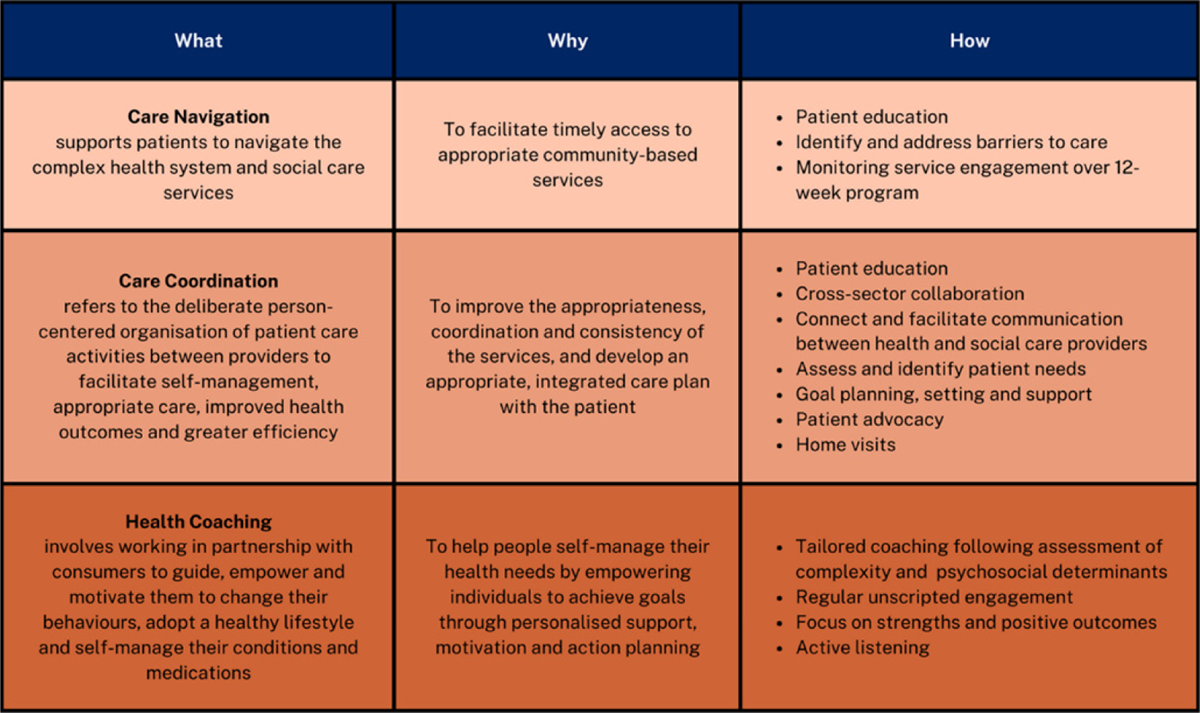
Table 3
PCBH interventions.
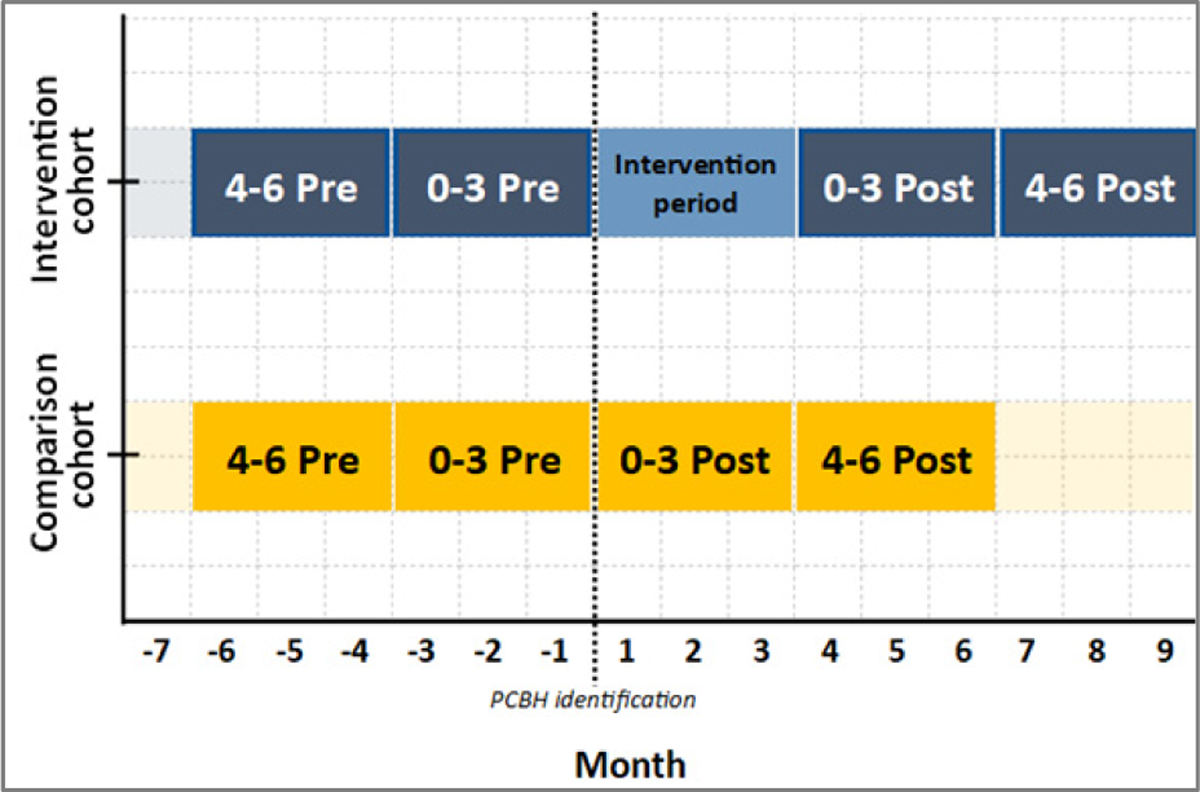
Figure 3
Demonstration of study periods.
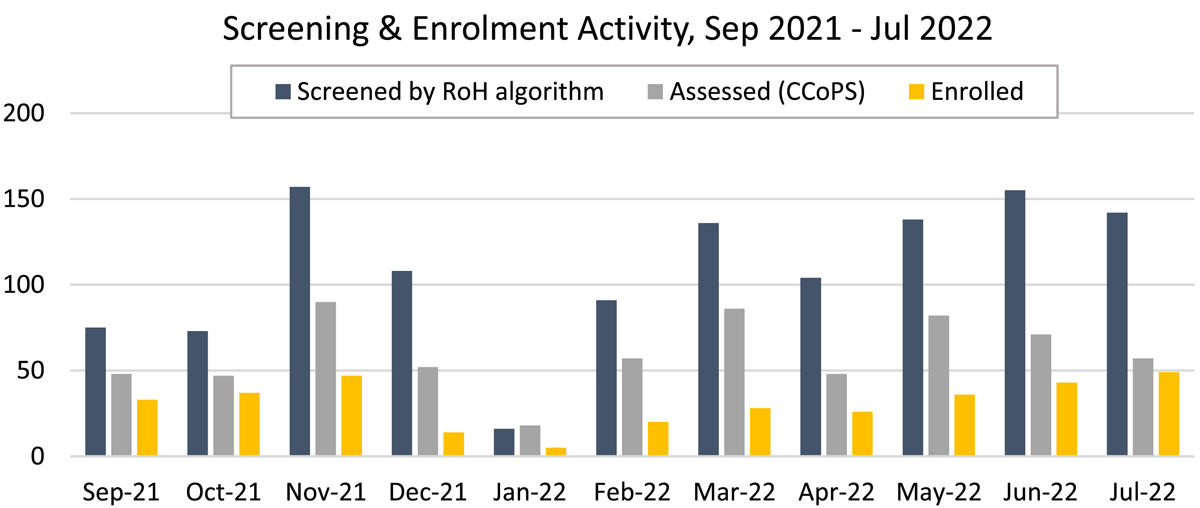
Figure 4
Screening and enrolment activity.
Table 4
Participants demographic, health and psychosocial characteristics.
| Characteristics | Intervention cohort (n = 60) | Comparison cohort (n = 60) |
|---|---|---|
| Age – Mean ± SD | 69 ± 15 | 61 ± 18 |
| Sex (%) | ||
| Male | 55.0% | 51.7% |
| Female | 45.0% | 48.3% |
| Country of origin (%) | ||
| Australia | 46.7% | 50.0% |
| Overseas | 53.3% | 50.0% |
| Primary language spoken (%) | ||
| English | 65.0% | 85.0% |
| Non-English | 35.0% | 15.0% |
| Chronic Disease (n) | ||
| Chronic Cardiac Condition | 38 | 38 |
| Chronic Pain | 36 | 39 |
| Diabetes, Renal Failure and/or Liver Disease | 33 | 20 |
| Chronic respiratory issues | 27 | 20 |
| Compromised skin integrity, e.g. wounds | 12 | 12 |
| Vulnerability (n) | ||
| Mental health and/or drug & alcohol issues | 35 | 33 |
| CALD background and/or limited English | 35 | 32 |
| Mental and/or physical disability | 30 | 35 |
| Financial issues | 8 | 2 |
| Social isolation | 4 | 4 |
| Risk factors and lifestyle concerns (n) | ||
| Lives in socio-economic disadvantaged area | 49 | 50 |
| Overweight, obesity or underweight | 31 | 25 |
| Dementia, falls, or incontinence | 30 | 21 |
| Hypercholesterolaemia | 27 | 31 |
| Reduced ability to self-care | 26 | 20 |
| Recent change to drug regimen | 22 | 26 |
| Physical inactivity | 20 | 12 |
| Smoking | 10 | 9 |
| Carer stress and/or no carer availability | 13 | 23 |

Figure 5
Cohort age distribution.
Table 5
Hospital utilisation before and after PCBH program.
| UNPLANNED HOSPITALISATIONS | TOTAL BED DAYS | AVERAGE LENGTH OF STAY (DAYS) | ED PRESENTATIONS | |||||
|---|---|---|---|---|---|---|---|---|
| INTERVENTION | COMPARISON | INTERVENTION | COMPARISON | INTERVENTION | COMPARISON | INTERVENTION | COMPARISON | |
| 0–3 months pre-PCBH program enrolment | 77 | 61 | 444 | 253 | 5.218 | 4.48 | 79 | 67 |
| 4–6 months pre-PCBH program enrolment | 33 | 20 | 104 | 113 | 3.486 | 5.889 | 56 | 49 |
| Total pre (0–6 months) | 110 | 81 | 548 | 366 | 8.704 | 10.369 | 135 | 116 |
| 0–3 months post-PCBH program completion | 52 | 40 | 126 | 151 | 3.754 | 4.009 | 30 | 30 |
| 4–6 months post-PCBH program completion | 33 | 35 | 174 | 159 | 5.492 | 5.063 | 42 | 18 |
| Total post (0–6 months) | 85 | 75 | 300 | 310 | 9.246 | 9.072 | 72 | 48 |
| Reduction pre-post (n) at 0–3 months | 25 | 21 | 318 | 102 | 1.464 | 0.471 | 49 | 37 |
| Reduction pre-post (%) at 0–3 months | 32.5% | 34.4% | 71.6% | 40.3% | 28.1% | 10.5% | 62.0% | 55.2% |
| Reduction pre/post (n) at 0–6 months | 25 | 6 | 248 | 56 | –0.542* | 1.297 | 63 | 68 |
| Reduction pre-post (%) at 0–6 months | 22.7% | 7.4% | 45.3% | 15.3% | –6.2% * | 12.5% | 46.7% | 58.6% |
[i] note that *indicates an increase in hospital use rather than a decrease.