
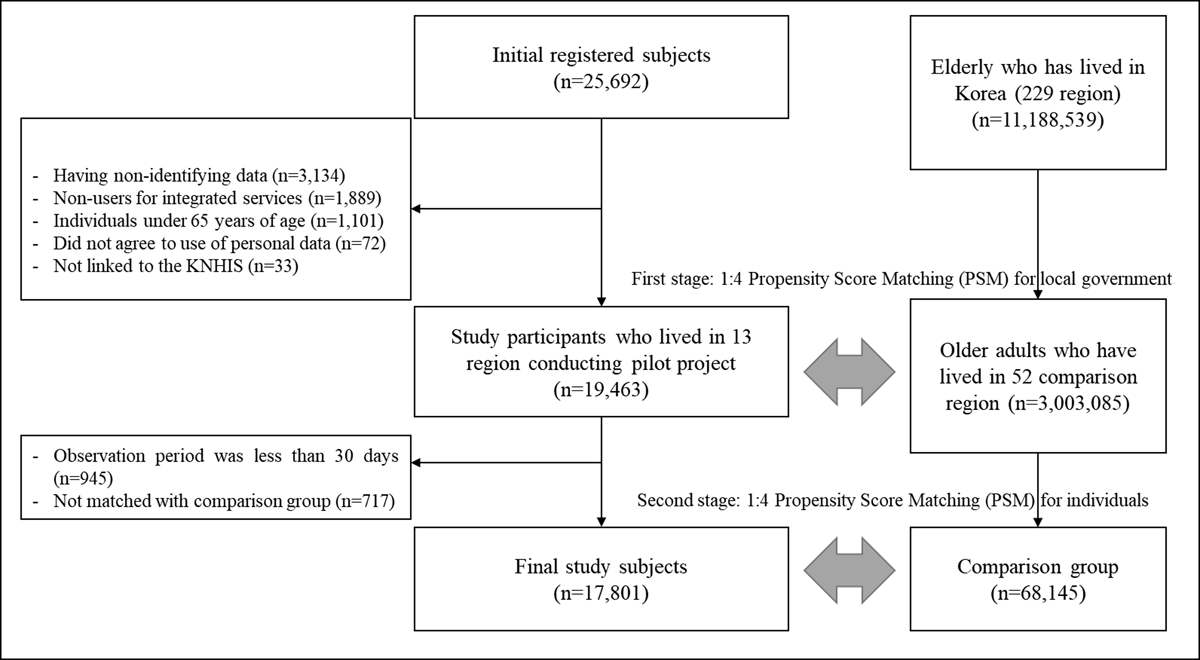
Figure 1
Flow chart of study participants.
Table 1
General characteristics of study subjects.
| VARIABLES | PRE-PSM | SD | POST-PSM | SD | |||||
|---|---|---|---|---|---|---|---|---|---|
| OLDER ADULTS WHO PARTICIPATED IN PILOT PROJECT | OLDER ADULTS WHO DID NOT PARTICIPATED IN PILOT PROJECT | OLDER ADULTS WHO DID NOT PARTICIPATED IN PILOT PROJECT | |||||||
| N | % | N | % | N | % | ||||
| Total | 17,801 | 20.7 | 3,003,085 | 100.0 | 68,145 | 79.3 | |||
| Sex | 0.314 | –0.037 | |||||||
| Men | 5,318 | 29.9 | 1,347,429 | 44.9 | 19,218 | 28.2 | |||
| Women | 12,483 | 70.1 | 1,655,656 | 55.1 | 48,927 | 71.8 | |||
| Age (mean ± standard deviation) | 79.8 | 6.6 | 72.6 | 7.7 | 1.008 | 79.9 | 6.8 | –0.004 | |
| Household Income | 0.314 | –0.037 | |||||||
| Q1 (Lowest) | 5,039 | 28.3 | 172,117 | 5.7 | 18,435 | 27.1 | |||
| Q2 | 2,787 | 15.7 | 563,815 | 18.8 | 10,468 | 15.4 | |||
| Q3 | 2,253 | 12.7 | 489,602 | 16.3 | 8,425 | 12.4 | |||
| Q4 | 2,422 | 13.6 | 651,630 | 21.7 | 9,169 | 13.5 | |||
| Q5 (Highest) | 5,300 | 29.8 | 1,082,021 | 36.0 | 21,648 | 31.8 | |||
| Grade of long-term care insurance | 0.385 | 0.055 | |||||||
| 1–2 grade | 224 | 1.3 | 50,986 | 1.7 | 686 | 1.0 | |||
| 3–5 grade and cognition support grade | 2,830 | 15.9 | 197,005 | 6.6 | 9,684 | 14.2 | |||
| None | 14,747 | 82.8 | 2,755,094 | 91.7 | 57,775 | 84.8 | |||
| History of Inpatients | 0.445 | 0.030 | |||||||
| Yes | 7,833 | 44.0 | 704,234 | 23.5 | 28,965 | 42.5 | |||
| No | 9,968 | 56.0 | 2,298,851 | 76.5 | 39,180 | 57.5 | |||
| Disability | 0.385 | 0.055 | |||||||
| Yes | 5,259 | 29.5 | 418,805 | 13.9 | 18,443 | 27.1 | |||
| No | 12,542 | 70.5 | 2,584,280 | 86.1 | 49,702 | 72.9 | |||
| Psychiatric diseases | 0.445 | 0.023 | |||||||
| Yes | 7,312 | 41.1 | 630,002 | 21.0 | 27,210 | 39.9 | |||
| No | 10,489 | 58.9 | 2,373,083 | 79.0 | 40,935 | 60.1 | |||
| CCI | 0.314 | –0.037 | |||||||
| 0 | 1,917 | 10.8 | 850,742 | 28.3 | 7,198 | 10.6 | |||
| 1 | 2,924 | 16.4 | 698,596 | 23.3 | 11,634 | 17.1 | |||
| 2 | 2,999 | 16.8 | 526,164 | 17.5 | 11,925 | 17.5 | |||
| 3 | 2,731 | 15.3 | 356,147 | 11.9 | 10,801 | 15.9 | |||
| 4 | 2,304 | 12.9 | 230,398 | 7.7 | 8,758 | 12.9 | |||
| 5 | 1,739 | 9.8 | 141,107 | 4.7 | 6,353 | 9.3 | |||
| 6≤ | 3,187 | 17.9 | 199,931 | 6.7 | 11,476 | 16.8 | |||
| Living alone | 0.706 | 0.001 | |||||||
| Yes | 10,215 | 57.4 | 736,471 | 24.5 | 39,104 | 57.4 | |||
| No | 7,586 | 42.6 | 2,251,200 | 75.0 | 29,041 | 42.6 | |||
[i] Abbreviation. PSM: propensity score matching, SD: standardized difference, CCI: Charlson’s comorbidity index.
Table 2
The results for changes of hospital admission rates by participation of pilot project for integrated care.
| SUBJECTS | N | PRE-REGISTRATION | POST-REGISTRATION | PRE-POST DIFFERENCES | DID | ||||
|---|---|---|---|---|---|---|---|---|---|
| N | % | N | % | %P | P-VALUE | OR (95% CI) | P-VALUE | ||
| Older adults who participated in pilot project | 17,801 | 7,006 | 39.4 | 6,091 | 34.2 | –5.2 | <.001 | 0.88 (0.84–0.91) | <.001 |
| Comparison group | 68,145 | 20,940 | 30.7 | 19,676 | 28.9 | –1.8 | <.001 | ||
[i] Abbreviation. LTCI: long-term care insurance, STD: standard deviation, DID: difference-in-differences.
Table 3
The results for changes of hospital admission rates by subgroups in pilot project for integrated care.
| TYPE | SUBJECTS | N | PRE-REGISTRATION | POST-REGISTRATION | PRE-POST DIFFERENCES | DID | ||||
|---|---|---|---|---|---|---|---|---|---|---|
| N | % | N | % | %P | P-VALUE | OR (95% CI) | P-VALUE | |||
| Older adults who utilized LTCI services | Older adults who participated in pilot project | 2,226 | 910 | 40.9 | 872 | 39.2 | –1.7 | 0.179 | 0.93 (0.83–1.05) | 0.238 |
| Comparison group | 8,181 | 3,081 | 37.7 | 3,063 | 37.4 | –0.3 | 0.726 | |||
| Older adults who applied for LTCI but were rejected or were intensive care group of customized care services for older adults | Older adults who participated in pilot project | 1,675 | 575 | 34.3 | 553 | 33.0 | –1.3 | 0.362 | 1.09 (0.95–1.26) | 0.229 |
| Comparison group | 6,400 | 1,961 | 30.6 | 1,791 | 28.0 | –2.6 | <.001 | |||
| Patients who discharged from medical institution | Older adults who participated in pilot project | 1,895 | 1,668 | 88.0 | 876 | 46.2 | –41.8 | <.001 | 0.17 (0.15–0.20) | <.001 |
| Comparison group | 7,175 | 2,972 | 41.4 | 2,317 | 32.3 | –9.1 | <.001 | |||
[i] Abbreviation. LTCI: long-term care insurance, STD: standard deviation, DID: difference-in-differences.