
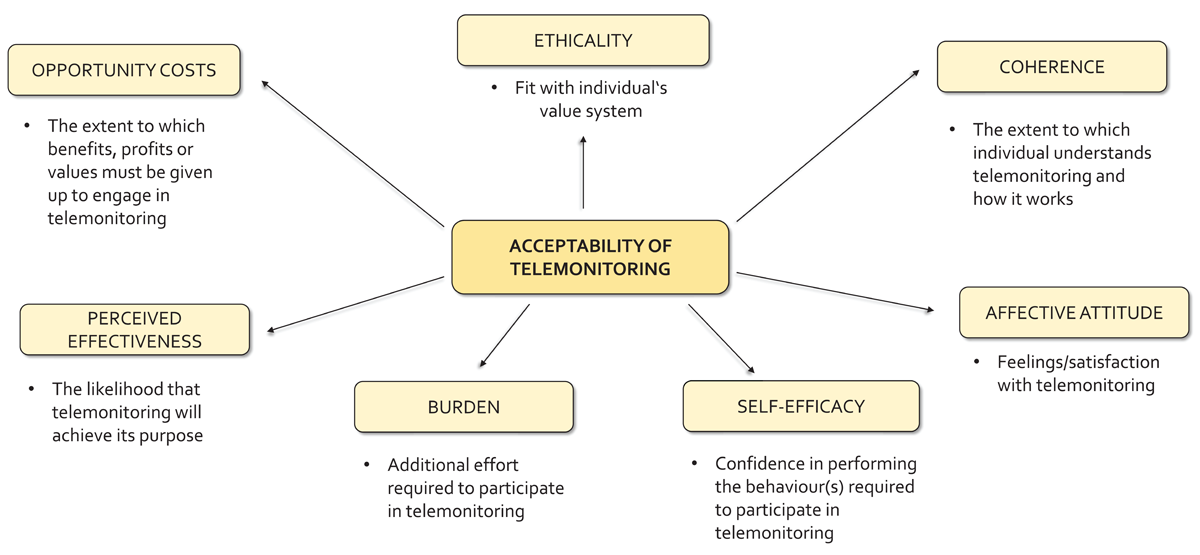
Figure 1
TFA domains in the context of telemonitoring.
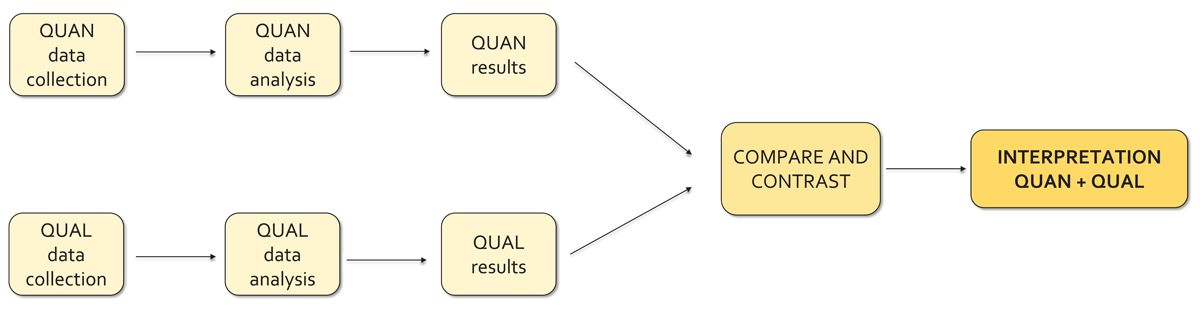
Figure 2
Convergence model used for data triangulation.
Table 1
Characteristics of the included participants.
| CHARACTERISTIC | QUALITATIVE STUDY (n = 29) | QUANTITATIVE SURVEY (n = 55) |
|---|---|---|
| SOCIO-DEMOGRAPHIC PROFILE | ||
| Mean age (years, SD) | 70.6 (5.1) | 70.6 (4.4) |
| Sex | ||
| Male (%) | 58.6 | 61.8 |
| Female (%) | 41.4 | 38.2 |
| Highest education achieved | ||
| Primary school (%) | 10.3 | 12.7 |
| Vocational school (%) | 58.6 | 60.0 |
| High school graduate (%) | 20.7 | 18.2 |
| Bachelor’s degree (%) | 6.9 | 5.5 |
| Master’s degree (%) | 3.4 | 3.6 |
| Region | ||
| Urban (%) | 69.0 | 49.1 |
| Rural (%) | 31.0 | 50.9 |
| Marital status | ||
| Married (%) | 69.0 | 74.5 |
| Divorced (%) | 3.4 | 3.6 |
| Widowed (%) | 20.7 | 18.2 |
| Single (%) | 6.9 | 3.6 |
| Smoking | ||
| Yes (%) | 20.7 | 16.4 |
| No (%) | 79.3 | 83.6 |
| CLINICAL CHARACTERISTICS | ||
| Mean duration of type 2 diabetes (years, SD) | 10.6 (6.6) | 9.8 (6.4) |
| Mean duration of hypertension (years, SD) | 15.8 (10.9) | 13.9 (10.7) |
| Mean systolic blood pressure (mmHg, SD) | 143.0 (12.9) | 136.4 (14.6) |
| Mean diastolic blood pressure (mmHg, SD) | 76.3 (7.7) | 75.8 (6.9) |
| Mean HbA1c (%, SD) | 7.3 (1.5) | 7.3 (1.2) |
| Mean body mass index (kg/m2, SD) | 29.6 (4.4) | 30.2 (4.6) |
| TELEMONITORING ROUTINE | ||
| Mean adherence to BP protocol (%, SD) | 142.6 (50.4) | 146.5 (70.5) |
| Mean adherence to BG protocol (%, SD) | 269.4 (183.2) | 252.8 (180.6) |
| Mean number of teleconsultations per year (n, SD) | 2.5 (1.7) | 2.5 (1.6) |
| Mean annual time to perform BP and BG measurements (min, SD) | 878 (231) | 885 (380) |
[i] Legend: SD – standard deviation, BP – blood pressure, BG – blood glucose.
Table 2
Coding tree representing the main themes and subthemes identified through qualitative data analysis and their anticipated influence on acceptability.
| THEME | SUBTHEME | INFLUENCE ON ACCEPTABILITY |
|---|---|---|
| Theme 1: Affective attitude | 1.1 Anticipatory anxiety in case of technical problems | ⊖ |
| 1.2 Attitude towards measurement protocol | ⊖ | |
| 1.3 Reassuring effect of normal readings | ⊕ | |
| 1.4 Role of patient-doctor relationship | ⊕ | |
| Theme 2: Burden | 2.1 Burden of measurement routine | ⊖ |
| 2.2 Inexperience with modern technologies | ⊖ | |
| 2.3 Technical problems | ⊖ | |
| 2.4 Burden of underlying diseases | ⊖ | |
| Theme 3: Perceived effectiveness | 3.1 Behavioural changes | ⊕ |
| 3.2 Understanding relationship between lifestyle and glycaemic control | ⊕ | |
| 3.3 Faster modification of therapy | ⊕ | |
| 3.4 Lack of integration into the public healthcare system | ⊖ | |
| 3.5 Regular response from telemedicine centre | ⊕ | |
| Theme 4: Ethicality | 4.1 Limited integration into patient environment | ⊖ |
| 4.2 Partner or family support | ⊕ | |
| Theme 5: Coherence | 5.1 Internalisation of benefits | ⊕ |
| 5.2 Education training | ⊕ | |
| Theme 6: Self-efficacy | 6.1 Confidence in self-management skills | ⊕ |
| 6.2 Previous experience with self-management of diabetes | ⊕ | |
| Theme 7: Opportunity costs | 7.1 Burden on family members | ⊖ |
| 7.2 Taking measurements during holidays | ⊖ |
Table 3
Quantitative ratings of acceptability domains.
| DIMENSION | URBAN REGION(n = 27), MEDIAN(min, max) | RURAL REGION(n = 28), MEDIAN (min, max) | COMBINED(n = 55), MEDIAN (min, max) | p |
|---|---|---|---|---|
| 1 AFFECTIVE ATTITUDE | ||||
| 1.1 Satisfaction with opportunity to participate | 5 (4, 5) | 5 (3, 5) | 5 (3, 5) | 0.150 |
| 1.2 Satisfaction with telemonitoring course | 5 (4, 5) | 5 (2, 5) | 5 (2, 5) | 0.471 |
| 2 BURDEN | ||||
| 2.1 Little extra time required to participate | 5 (4, 5) | 4 (1, 5) | 5 (2, 5) | 0.182 |
| 2.2 Much extra time required to learn how to use telemonitoring equipment (R) | 4.5 (1, 5) | 4 (1, 5) | 4 (1, 5) | 0.009 |
| 2.3 Much extra effort needed to participate (R) | 5 (1, 5) | 4 (1, 5) | 4 (1, 5) | 0.004 |
| 3 PERCEIVED EFFECTIVENESS | ||||
| 3.1 Improved knowledge and understanding of diseases | 4.5 (3, 5) | 5 (4, 5) | 5 (3, 5) | 0.380 |
| 3.2 Improved health | 5 (4, 5) | 4 (3, 5) | 4 (3, 5) | 0.362 |
| 3.3 Gained experience with self-management skills | 4 (3, 5) | 4 (1, 5) | 4 (1, 5) | 0.786 |
| 4 ETHICALITY | ||||
| 4.1 Agreement with individual’s beliefs and values | 5 (4, 5) | 4 (1, 5) | 4 (1, 5) | 0.101 |
| 5 COHERENCE | ||||
| 5.1 Adequate data on content and process of telemonitoring | 4.5 (3, 5) | 4 (3, 5) | 4 (3, 5) | 0.716 |
| 5.2 Good understanding of objectives of telemonitoring | 5 (4, 5) | 4 (3, 5) | 4.5 (3, 5) | 0.298 |
| 6 SELF-EFFICACY | ||||
| 6.1 Confidence in applying the skills learned in daily life | 4 (3, 5) | 4 (4, 5) | 4 (1, 5) | 0.557 |
| 7 OPPORTUNITY COSTS | ||||
| 7.1 Less time for family and friends (R) | 5 (1, 5) | 5 (2, 5) | 5 (1, 5) | 0.921 |
| 7.2 Less time for hobbies (R) | 5 (3, 5) | 5 (1, 5) | 5 (1, 5) | 0.905 |
| MEAN COMBINED SCORES (95% CI) | 4.5 (4.4–4.7) | 4.3 (4.1–4.5) | 4.4 (4.3–4.5) | 0.066 |
[i] Legend: R – reversed scores are shown.