
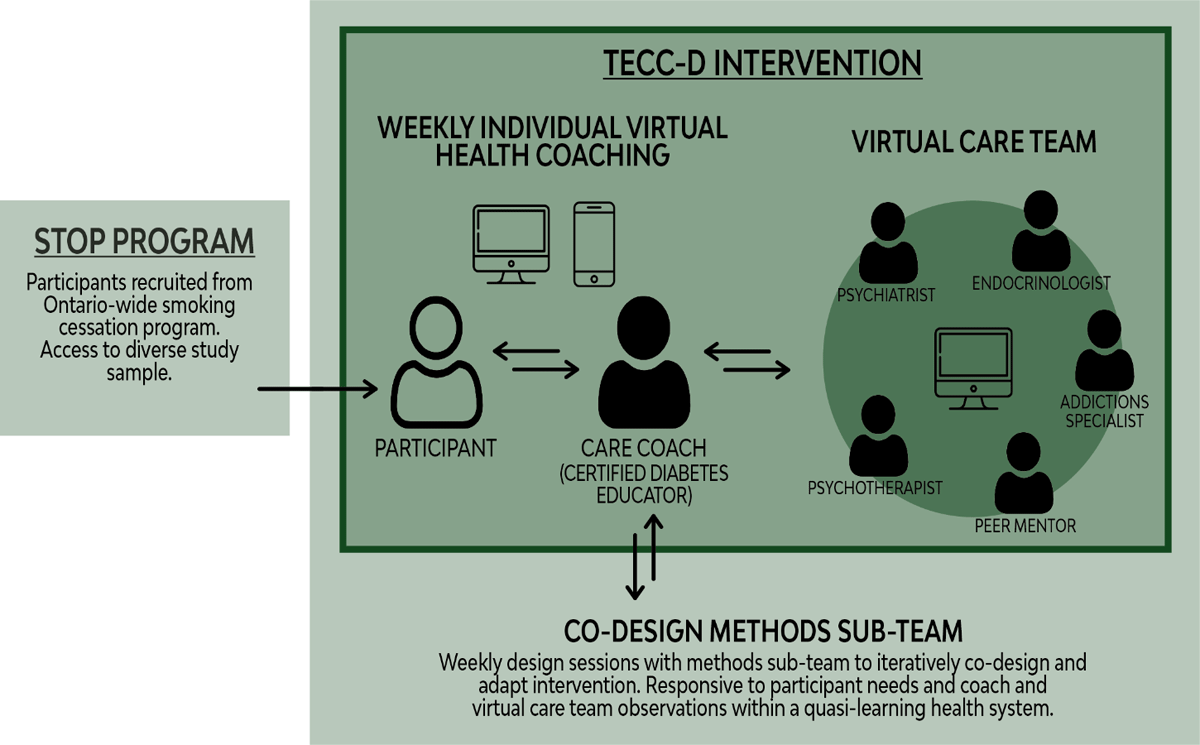
Figure 1
TECC-D Intervention.
Table 1
Participant Sociodemographic and Health Characteristics.
| PARTICIPANT SOCIODEMOGRAPHIC CHARACTERISTICS (n = 31) | ||
|---|---|---|
| Gender | n | Proportion (%) |
| Woman | 15 | 48.39 |
| Man | 16 | 51.61 |
| Age | ||
| Median Age (Range) | 61 (37–74) | |
| n | Proportion (%) | |
| 35–45 years | 3 | 9.68 |
| 45–55 years | 9 | 29.03 |
| 55–65 years | 14 | 45.16 |
| >65 years | 5 | 16.13 |
| Ethnicity (not mutually exclusive) | n | Proportion (%) |
| Asian, South-East (i.e., Malaysia, Philippines, Vietnam) | 1 | 3.23 |
| Asian, South (i.e., India, Pakistan, Sri Lanka) | 1 | 3.23 |
| Black, North American (i.e., Canada, America) | 1 | 3.23 |
| First Nations, Inuit, Metis | 2 | 6.45 |
| White, European or North American | 23 | 74.19 |
| Mixed Heritage | 2 | 6.45 |
| Do Not Know | 1 | 3.23 |
| Marital Status | n | Proportion (%) |
| Single, Never Married | 4 | 12.90 |
| Married or Domestic Partnership | 11 | 35.48 |
| Widowed | 1 | 3.23 |
| Separated or Divorced | 14 | 45.16 |
| Prefer Not to Answer | 1 | 3.23 |
| Education Level | n | Proportion (%) |
| Some High School | 5 | 16.13 |
| High School Diploma | 5 | 16.13 |
| Some College or University | 7 | 22.58 |
| College Diploma or University Degree | 14 | 45.16 |
| Employment Status | n | Proportion (%) |
| Currently Working | 4 | 12.90 |
| Not Currently Working | 24 | 77.42 |
| Permanently Unable to Work | 3 | 9.68 |
| Household Income | n | Proportion (%) |
| <$10,000 | 2 | 6.45 |
| $10,000–$40,000 | 13 | 41.94 |
| $40,001–$80,000 | 9 | 29.03 |
| $80,001–$100,000 | 2 | 6.45 |
| >$100,000 | 1 | 3.23 |
| Don’t Know / Prefer Not to Answer | 4 | 12.90 |
| Participant Health Characteristics (n = 31) | ||
| Years with Type-2 Diabetes | ||
| Median Years (Range) | 6.5(1–27) | |
| Current Medication Use (Any) | n | Proportion (%) |
| Yes | 30 | 96.77 |
| No | 0 | 0 |
| Prefer Not to Answer | 1 | 3.23 |
| Current Insulin Use | n | Proportion (%) |
| Yes | 6 | 19.35 |
| No | 24 | 77.42 |
| Prefer Not to Answer | 1 | 3.23 |
| Financial Concern about Diabetes Care | n | Proportion (%) |
| Yes, a Current Concern | 11 | 35.48 |
| Yes, a Past Concern but Not Now | 8 | 25.81 |
| No, Not a Concern | 12 | 38.71 |
Table 2
Participant Engagement and Intervention Delivery.
| MEASURE (n = 31) | ||
|---|---|---|
| Participant Recruitment and Engagement | ||
| Method of Recruitment | n | Proportion (%) |
| STOP Program | 31 | 100 |
| Recruitment Rate | 31/130 | 23.85% |
| Retention Rate | ||
| Median Number of Weeks BetweenFirst and Last Interaction (Range) | 8(0–11.86) | |
| Drop-Out Rate | n | Proportion (%) |
| Did Not Attend One-on-One | 5 | 16.12 |
| Intervention Delivery | ||
| Intensity | ||
| Median Number of Interactions (Range) | 7(0–10) | |
| Time Spent Per Interaction | ||
| Median Time for All Visits in Minutes (Range) | 35(6–90) | |
| Mode of Interaction | n | Proportion (%) |
| Telephone only | 11 | 35.48 |
| WebEx only | 7 | 22.58 |
| Combination (Telephone and WebEx) | 9 | 29.03 |
Table 3
Joint Display of TECC-D Strategies and Recommendations.
| TECC-D IMPLEMENTATION | DESCRIPTION/QUOTE/CHART DATA | |
|---|---|---|
| Strategy and Recommendations | ||
| Diabetes Self-Management Education/Support | n = 25 | Participants described receiving broad information and resources regarding diabetes self-management and support. This included information about diet, education specific to interpreting lab values, identifying patterns and assisting with pattern management, exercise, medications, and linking pathophysiology of diabetes to treatment to enhance goal development. “She gave me options, like, at the diabetes center I attend, they gave me one particular way to eat during the day. [Health Coach] gave me more options. The fact that I could have a regular appointment with someone to discuss this was helpful.” – Participant 21 |
| Number of Times Strategy Used | 82 | |
| Glucose Monitoring | n = 14 | |
| Number of Times Recommendation Used | 21 | |
| Diabetes Medication Adjustment | n = 2 | |
| Number of Times Recommendation Used | 2 | |
| Behavioural Change | n = 23 | Topics such as motivation and habits were discussed as participants identified personal health goals. Supported by Diabetes Canada recommendations and guidelines, [37] and using a tiny habit approach, the health coach shared potential options for change and assisted participants in articulating and refining their goals. “It never felt like we were doing anything really structured. It was like having a chat with a friend, but that friend had all this knowledge and this team of specialists to support her. It didn’t feel like she was following an itinerary or that she had specific steps to follow. It was organic and specific to me, and I think that’s why I was able to make some big changes for both my physical and mental health – changes that I have needed to make for many, many years.” – Participant 31 |
| Number of Times Strategy Used | 87 | |
| Diabetes Medication Adherence | n = 10 | |
| Number of Times Recommendation Used | 13 | |
| Dietary Modification | n = 21 | |
| Number of Times Recommendation Used | 39 | |
| Exercise Modification | n = 11 | |
| Number of Times Recommendation Used | 26 | |
| Case Management | n = 25 | Based on participant need, the health coach would research and connect participants to both diabetes and non-diabetes-specific resources. For example, this included diabetes education resources or addiction programs. “Like, I go to these diabetes classes, right? But we don’t talk about how diabetes is different for each of us. Like, I have friends with diabetes, and they don’t worry about food at all. I worry a lot.” – Participant 23 |
| Number of Times Strategy Used | 76 | |
| System Navigation | n = 17 | |
| Number of Times Recommendation Used | 31 | |
| Psychosocial Support | n = 24 | Comprehensive psychosocial support was provided by the health coach. This included the use of motivational interviewing to build rapport and promote a supportive environment where participants felt they could identify challenges and struggles, work through them, and celebrate success. |
| Number of Times Strategy Used | 111 | |
| Other | n = 9 | Participants identified broad goals and needs during study visits. For example, and in addition to specific diabetes and health needs, this included support with smoking cessation, alcohol use, and past trauma. The health coach encouraged self-referrals to community supports specific to participant need. “We started focusing on that and where I could get help with my alcohol use. I’m in a group now. I go every Thursday.”– Participant 10 |
| Number of Times Strategy Used | 12 | |
| External Referral | n = 9 | |
| Number of Times Recommendation Used | 11 |