
Table 1
Uonuma School for Community Health and Social Care: Cumulative Number of Participants and Various Types of Meetings.
| OBJECTS | TYPES OF MEETING | 2011–2013 | N | 2014–2016 | N | 2017–2020 | N | 2011–2020 | N |
|---|---|---|---|---|---|---|---|---|---|
| Open school | 3,836 a | 49 | 1,439 | 31 | 1,413 | 50 | 6,688 | 131 | |
| Adult | |||||||||
| residents | Night school | 709 | 22 | 339 | 13 | 97 | 4 | 1,145 | 39 |
| Class in school | 3,872 | 48 | 3,530 | 54 | 5,325 | 97 | 12,727 | 199 | |
| Elementary and junior high school pupils | Open hospital | 102 | 21 | 166 | 39 | 218 | 52 | 486 | 112 |
| Professionals | Interprofessional education and collaboration in practice | 3,768 | 101 | 3,621 | 77 | 4,676 | 116 | 12,065 | 294 |
| Medical students | 325 | 271 | 490 | 1,086 | |||||
| Clinical trainees | From four programmes | 86 | 78 | 65 | 229 | ||||
| Total medical management | 69 | 179 | 248 | ||||||
| TOTAL | Cumulative numbers | 12,408 | 241 | 9,513 | 214 | 12,398 | 319 | 34,317 | 774 |
[i] Note: N = number of meetings for residents. a Including 309 participants for ‘All Together Better Health VI’ [13]. Begins in April each year and ends in March of the following year.
Table 2
Numbers of Participants in Diabetes Courses (2011–2020).
| OUTCOMES MEETINGS | SUPPRESSION OF INCREASE OF PREVALENCE OF HbA1c ≥ 8% | |||
|---|---|---|---|---|
| SUPPRESSION OF INDUCTION OF DIALYSIS | ||||
| OPEN SCHOOL NIGHT SCHOOL | RAKU-GOI : COMMON LANGUAGE COURSE | |||
| MEETINGS | PARTICIPANTS | MEETINGS | PARTICIPANTS | |
| Number | 97 | 3,435 | 17 | 745 |
| Total | Meetings: 114 | Participants: 4,180 | ||
| Samples of theme/contents |
| |||
[i] Raku-goi: Common language course; i.e., NPG course: Non-professional glossary course.

Figure 1
Comparison of HbA1c values (total and those ≥ 8.0%) before and after the start of Project 8 and the Uonuma School for Community Health and Social Care. The blue bars depict the total number of HbA1c tests in the Koide Hospital annually from 2005 to 2020. The brown bars depict HbA1c ≥ 8.0% patients. The annual percentages of HbA1c ≥ 8.0% patients for the entire exam are illustrated as a line graph. All values from the Japan Diabetes Society (JDS) units from 2005 to 2011 were converted to National Glycohemoglobin Standardization Program (NGSP) units after 2012. P8 began in 2008, and the Uonuma School for Community Health and Social Care started in 2011.

Figure 2
Comparison of mean HbA1c every three to four years before and after the start of Project 8 and the Uonuma School for Community Health and Social Care. The X-axis denotes the stage duration (three to four years); the Y-axis denotes HbA1c (%, NGSP). Mean HbA1c every three to four years during 2005–2020 were compared. Stage B, from 2005 to 2007, indicates a period without IPCP. Stage A1, from 2008 to 2010, designates the period of IPCP within the hospital, as well as IPCP between a clinic and a hospital, aiming for HbA1c of less than 8.0%. Stage A2, from 2011 to 2013, shows the period of IPCP within the hospital, and between a clinic and a hospital, and community-resident participation, following commencement of the Uonuma School. Stage A3, from 2014 to 2016, refers to the period when staff became cognizant of the hospital’s specialisation in the management of chronic illnesses in primary care after the reorganisation of hospitals in the Uonuma area in 2015. Stage A4, from 2017 to 2020, is the period when guidelines for diabetes mellitus published in 2017 allowed for the maintenance of slightly higher HbA1c in older adults.
A one-way ANOVA test, post hoc test, and t-test with Bonferroni correction were applied to compare all of the integrated criteria. Statistical significance was set as p < 0.05 and p < 0.01. R version 3.6.2 (The R Foundation for Statistical Computing, Austria) was used for all statistical analyses.
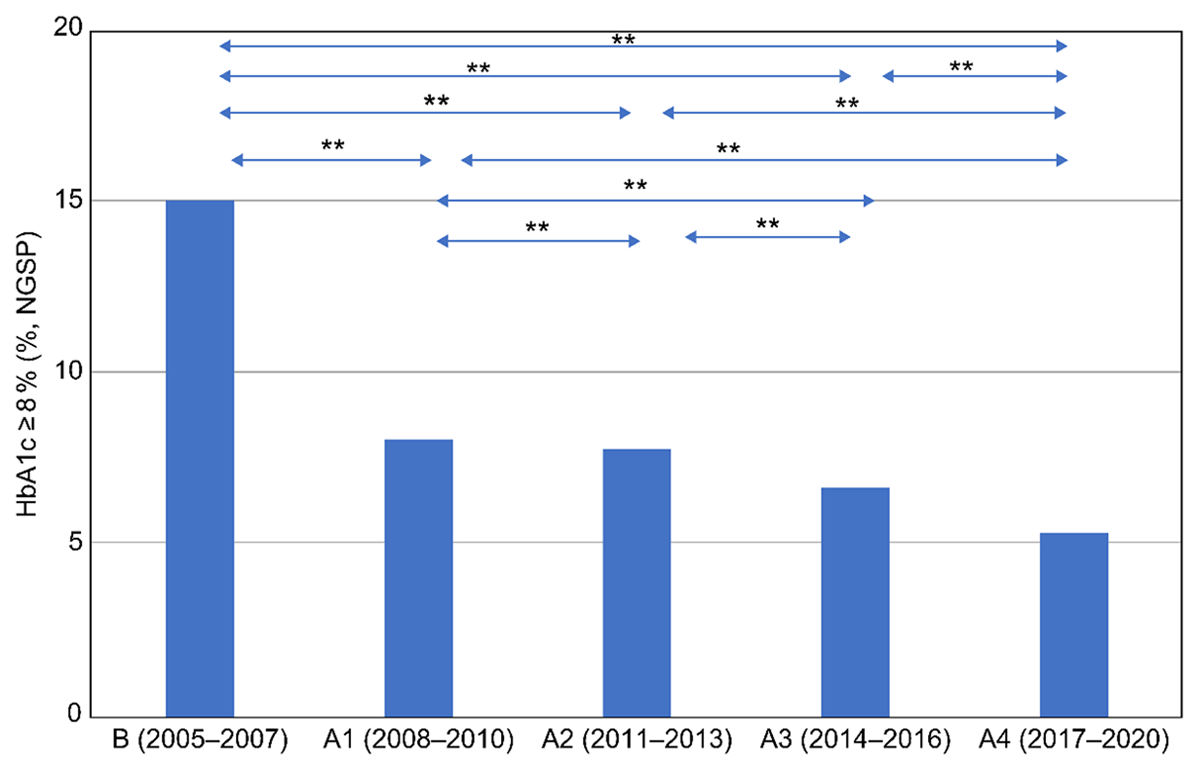
Figure 3
Comparison of HbA1c ≥ 8.0% before and after the start of Project 8 and the Uonuma School for Community Health and Social Care. The HbA1c ≥ 8.0% group was compared every three to four years, from 2005 to 2020. The classification of stages from 2005 to 2020 is the same as in Figure 2. A chi-square test, post hoc test, and Ryan’s multiple comparison were applied to compare all integrated criteria. * p < 0.05 and ** p < 0.01 were considered statistically significant. R version 3.6.2 (The R Foundation for Statistical Computing, Austria) was used for all statistical analyses.