
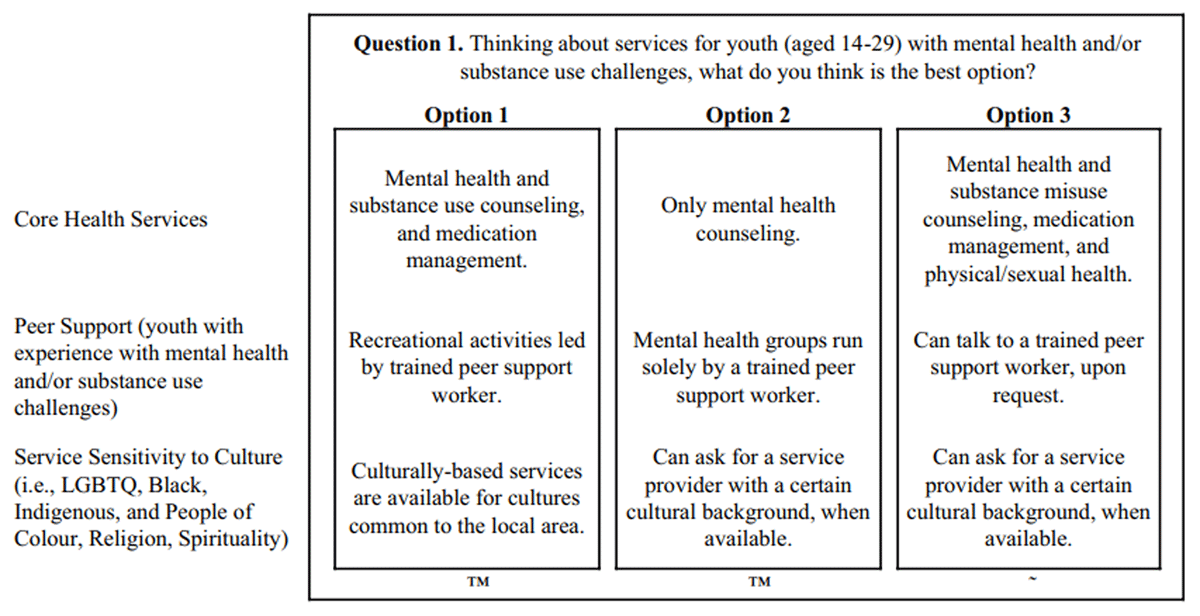
Figure 1
A sample DCE choice task.
Table 1
Sociodemographic and clinical characteristics of caregivers of justice-involved (C-YJ) and caregivers of non-justice-involved (C-non-YJ) participants, with significance tests and effect sizes.
| GROUP | C-YJ | C-non-YJ | χ2 (df) | p | Φ |
|---|---|---|---|---|---|
| (n = 46) | (n = 204) | ||||
| Gender | n (%) | n (%) | 2.19 (2) | .335 | .0951 |
| Woman | 42 (97.7) | 183 (91.0) | |||
| Man | 1 (2.3) | 17 (8.5) | |||
| Transgender/non-binary | 0 (0.0) | 1 (0.5) | |||
| Race/Ethnicity | 4.12 (4) | .392 | .1281 | ||
| White | 41 (89.1) | 168 (82.8) | |||
| Other | 1 (2.2) | 20 (9.9) | |||
| Asian | 3 (6.5) | 10 (4.9) | |||
| Black | 0 (0.0) | 3 (1.5) | |||
| Indigenous | 1 (2.2) | 2 (1.0) | |||
| Socioeconomic Status | 2.01 (3) | .566 | .0901 | ||
| Live comfortably | 27 (58.7) | 125 (61.3) | |||
| Meets needs with a little left | 13 (28.3) | 45 (22.1) | |||
| Just meets basic expenses | 6 (13.0) | 28 (13.7) | |||
| Does not meet basic expenses | 0 (0.0) | 6 (2.9) | |||
| Marital Status | 1.16 (2) | .560 | .068 | ||
| Married or common law | 29 (65.9) | 150 (73.5) | |||
| Single, separated, or divorced | 13 (29.5) | 45 (22.1) | |||
| Other | 2 (4.5) | 9 (4.4) | |||
| Region of Residence | 4.05 (2) | .132 | .128 | ||
| Rural to Small Population | 11 (23.9) | 25 (12.4) | |||
| Medium Population | 8 (17.4) | 36 (17.9) | |||
| Large Urban Population | 27 (58.7) | 140 (69.7) | |||
| Physical Health | .998 (1) | .318 | .063 | ||
| Good to excellent | 42 (93.1) | 175 (85.8) | |||
| Fair to poor | 4 (8.7) | 29 (14.2) | |||
| Mental Health | .630 (1) | .466 | .050 | ||
| Good to excellent | 36 (78.3) | 148 (72.5) | |||
| Fair to poor | 10 (21.7) | 56 (27.5) | |||
| Education Level | .270 (2) | .874 | .034 | ||
| High school or less | 2 (4.8) | 10 (5.2) | |||
| Some college/university | 7 (16.7) | 26 (13.6) | |||
| Graduated college/university | 33 (78.6) | 155 (81.2) | |||
| Employed | 4.01 (1) | .045 | .127 | ||
| Yes | 36 (80.0) | 131 (64.5) | |||
| No | 9 (20.0) | 72 (35.5) |
[i] 1 Cramer’s V (V∈) was used as a measure of effect size due to small cell sizes.
Table 2
Sociodemographic and clinical characteristics of justice-involved (YJ) non-justice-involved (non-YJ) youth as reported by caregivers, with significance tests and effect sizes.
| GROUP | YJ | NON-YJ | χ2 (df) | p | Φ |
|---|---|---|---|---|---|
| (n = 46) | (n = 204) | ||||
| Gender | n (%) | n (%) | 16.77 (2) | <.001 | .2601 |
| Woman | 13 (28.3)* | 107 (52.7)* | 9.0 (1) | .003 | |
| Man | 32 (69.6)* | 75 (36.9)* | 16.0 (1) | <.001 | |
| Transgender/non-binary | 1 (2.2) | 21 (10.3) | 3.24 (1) | .072 | |
| Race/Ethnicity | 4.81 (4) | .308 | .1391 | ||
| White | 36 (78.3) | 159 (78.3) | |||
| Other | 5 (10.9) | 32 (15.8) | |||
| Asian | 3 (6.5) | 7 (3.4) | |||
| Black | 0 (0.0) | 3 (1.5) | |||
| Indigenous | 2 (4.3) | 2 (1.0) | |||
| Relationship to Youth | 1.90 (3) | .595 | .0871 | ||
| Parent | 41 (89.1) | 190 (93.1) | |||
| Grandparent | 0 (0.0) | 2 (1.0) | |||
| Sibling or other relative | 2 (4.3) | 5 (2.5) | |||
| Other | 3 (6.5) | 7 (3.4) | |||
| Physical Health | 2.24 (1) | .135 | .095 | ||
| Good to excellent | 24 (52.2) | 130 (64.0) | |||
| Poor to fair | 22 (47.8) | 73 (36.0) | |||
| Mental Health | .851 (1) | .356 | .058 | ||
| Good to excellent | 4 (8.7) | 28 (13.7) | |||
| Poor to fair | 42 (91.3) | 176 (86.3) | |||
| Student Status | 11.03 (1) | .001 | .210 | ||
| Part- or full-time enrollment | 15 (32.6) | 121 (59.6) | |||
| Not enrolled | 31 (67.4) | 82 (40.4) | |||
| Education Level | 3.95 (2) | .139 | .126 | ||
| High school or less | 37 (80.4) | 134 (65.7) | |||
| Some college/university | 5 (10.9) | 45 (22.1) | |||
| Graduated college/university | 4 (8.7) | 25 (12.3) | |||
| Employment Status | 2.34 (3) | .506 | .0971 | ||
| Full-time | 5 (10.9) | 22 (10.8) | |||
| Part-time | 8 (17.4) | 54 (26.6) | |||
| Unemployed | 29 (63.0) | 105 (51.7) | |||
| Other | 4 (8.7) | 23 (10.8) | |||
| Housing | 6.66 (4) | .070 | .1861 | ||
| Lives independently | 3 (6.5) | 14 (6.9) | |||
| With a partner | 5 (10.9) | 11 (5.4) | |||
| With family | 29 (63.0) | 151 (74.0) | |||
| With friends | 0 (0.0) | 10 (4.9) | |||
| Other/transitional-housing | 9 (19.6) | 18 (8.8) |
[i] * Statistically significant at the Bonferroni corrected p-value of .017.
1 Cramer’s V (V∈) was used as a measure of effect size due to small cell sizes.
Table 3
The relative importance of each IYS attribute for caregivers of justice-involved and non-justice-involved youth, and between-group MANOVA Pillai’s Trace statistic.
| JUSTICE-INVOLVED | NON- JUSTICE-INVOLVED | ||||||
|---|---|---|---|---|---|---|---|
| ATTRIBUTE | n = 46 | n = 204 | F (df) | p | ηp2 | ||
| M | SD | M | SD | ||||
| 1. Core Health Services | 8.01% | 1.65 | 6.90% | 2.16 | 10.74 (1)a | .001* | .042 |
| 2. Other Services | 9.64% | 1.75 | 8.27% | 1.92 | 19.56 (1) | <.001* | .073 |
| 3. Caregiver Involvement | 11.68% | 2.70 | 11.15% | 2.50 | 1.64 (1) | .201 | .007 |
| 4. Peer Support | 5.70% | 1.72 | 6.20% | 2.33 | 1.89 (1)a | .170 | .008 |
| 5. Cultural Sensitivity | 4.97% | 2.16 | 5.76% | 2.19 | 4.87 (1) | .028 | .019 |
| 6. E-Health Services | 9.17% | 1.92 | 10.25% | 1.98 | 11.29 (1) | <.001* | .044 |
| 7. Age Range | 6.68% | 1.87 | 7.45% | 2.55 | 3.75 (1)a | .054 | .015 |
| 8. Time of Appointments | 8.47% | 2.04 | 7.91% | 2.49 | 2.00 (1) | .158 | .008 |
| 9. Wait Time | 9.86% | 2.37 | 11.89% | 2.50 | 25.20 (1) | <.001* | .092 |
| 10. Location | 8.16% | 1.78 | 7.91% | 1.96 | 0.64 (1) | .425 | .003 |
| 11. Engagement | 3.77% | 1.70 | 3.98% | 1.68 | 0.53 (1) | .466 | .002 |
| 12. Information Sharing | 13.90% | 2.61 | 12.35% | 2.96 | 10.82 (1) | .001* | .042 |
| Total | 100% | 100% | |||||
[i] IYS = Integrated Youth Service.
a Levene’s test of equality of error variance statistically significant.
* Statistically significant at the Bonferroni corrected p-value of .0042.
Table 4
Utility values of IYS levels for caregivers of justice-involved and non-justice-involved youth, and between-group MANOVA Pillai’s Trace statistic on attributes with follow-up Bonferroni corrected ANOVA results on levels.
| JUSTICE-INVOLVED | NON-JUSTICE-INVOLVED | |||||||
|---|---|---|---|---|---|---|---|---|
| ATTRIBUTE LEVELS | n = 46 | n = 204 | V | F(df) | p | ηP2 | ||
| M | SD | M | SD | |||||
| 1. Core Health Services | .261 | 28.92 (3,246) | <.001 | .261 | ||||
| Only mental health counseling. | –59.82 | 12.05 | –43.56 | 16.00 | 42.11 (1) | <.001* | .145 | |
| Mental health and substance misuse counseling. | 15.00 | 12.01 | –2.22 | 13.50 | 63.49 (1) | <.001* | .204 | |
| Mental health and substance misuse counseling, and medication management. | 14.87 | 10.59 | 11.33 | 12.30 | 3.27 (1) | .072 | .013 | |
| Mental health and substance misuse counseling, medication management, and physical/sexual health. | 29.95 | 16.50 | 34.45 | 20.88 | 1.87 (1) | .173 | .007 | |
| 2. Other Services | .091 | 8.19 (3,246) | <.001 | .091 | ||||
| Education and employment services. | –5.65 | 19.27 | –9.28 | 18.93 | 1.37 (1) | .243 | .005 | |
| Housing, shelter and income support services. | 16.57 | 17.41 | 18.11 | 20.68 | .220 (1) | .640 | .001 | |
| Legal support services. | –62.72 | 14.32 | –52.42 | 17.28 | 14.17 (1) | <.001* | .054 | |
| Choice of education, employment, housing, income support, and legal support services. | 51.80 | 11.96 | 43.58 | 12.16 | 17.27 (1) | <.001* | .065 | |
| 3. Caregiver Involvement | .160 | 15.60 (3,246) | <.001 | .160 | ||||
| No caregiver involvement. | –83.90 | 19.29 | –84.22 | 20.67 | .009 (1) | .925 | .000 | |
| Caregivers receive own counseling. | –5.37 | 17.65 | 15.16 | 21.29 | 37.01 (1) | <.001* | .130 | |
| Caregivers involved in family counseling with youth, with youth consent. | 51.23 | 21.14 | 34.51 | 21.29 | 23.21 (1) | <.001* | .086 | |
| Caregivers involved in decisions regarding youth counseling, with youth consent. | 38.05 | 17.46 | 34.55 | 20.71 | 1.13 (1) | .288 | .005 | |
| 4. Peer Support | .138 | 13.07 (3,246) | <.001 | .138 | ||||
| Recreational activities led by trained peer support worker. | –22.72 | 13.63 | –28.93 | 16.36 | 5.73 (1) | .017 | .023 | |
| Can talk to a trained peer support worker, upon request. | –9.66 | 12.03 | 2.57 | 15.50 | 25.19 (1) | <.001* | .092 | |
| Mental health groups run solely by a trained peer support worker. | –7.31 | 17.44 | –11.49 | 21.69 | 1.49 (1) | .224 | .006 | |
| Youth can be matched to an ongoing trained peer support worker to learn life skills and help them with services they need. | 39.69 | 15.05 | 37.85 | 18.82 | .384 (1)a | .536 | .002 | |
| 5. Cultural Sensitivity | .392 | 52.96 (3,246) | <.001 | .392 | ||||
| Cultural background is not considered when picking a service or service provider. | –2.85 | 20.01 | –27.36 | 21.04 | 51.81 (1) | <.001* | .173 | |
| Can ask for a service provider with a certain cultural background, when available. | –10.70 | 11.83 | 9.33 | 11.13 | 118.78 (1) | <.001* | .324 | |
| Services are culturally sensitive and trauma-informed. | 30.39 | 22.08 | 26.14 | 26.85 | .998 (1) | .319 | .004 | |
| Culturally-based services are available for cultures common in the local area. | –16.84 | 14.58 | –8.11 | 16.41 | 11.04 (1) | <.001* | .043 | |
| 6. E-Health Services | .079 | 7.02 (3,246) | <.001 | .079 | ||||
| No e-health or electronic services. | –41.09 | 18.33 | –51.33 | 23.07 | 7.92 (1) | .005* | .031 | |
| Can schedule or reschedule appointments via email, text or online. | 24.28 | 11.95 | 34.52 | 15.93 | 16.82 (1)a | <.001* | .064 | |
| E-health services are offered 24/7 alongside in-person services during office hours. | 56.69 | 15.13 | 56.37 | 21.32 | .009 (1) | .924 | .000 | |
| All services are delivered only through a website, e-mail, text, or phone app. | –39.88 | 19.94 | –39.56 | 22.40 | .008 (1) | .929 | .000 | |
| 7. Age Range | .100 | 9.07 (3,246) | <.001 | .100 | ||||
| Services for ages 12–24, in a youth-only setting. | –2.58 | 21.68 | 12.55 | 23.16 | 16.38 (1) | <.001* | .062 | |
| Services for ages 12–29, in a youth-only setting. | 28.22 | 14.18 | 24.50 | 21.74 | 1.23 (1)a | .269 | .005 | |
| Services for ages 12–24, in a setting that also has services for children 0–12. | –39.26 | 18.27 | –43.54 | 22.92 | 1.40 (1) | .238 | .006 | |
| Services for ages 12–29, in a setting that also has services for adults 29+. | 13.62 | 27.42 | 6.49 | 33.49 | 1.81 (1) | .180 | .007 | |
| 8. Time of Appointments | .133 | 12.55 (3,246) | <.001 | .133 | ||||
| Monday to Friday, 9AM-5PM. | –51.71 | 16.37 | –44.82 | 21.84 | 4.06 (1) | .045 | .016 | |
| Monday to Friday, 9AM-9PM. | –11.77 | 14.69 | –12.69 | 19.10 | .096 (1)a | .757 | .000 | |
| Monday to Friday, 9AM-9PM, and Saturday, 9AM-5PM. | 44.18 | 14.86 | 28.36 | 17.46 | 32.44 (1) | <.001* | .116 | |
| 24/7. | 19.29 | 25.40 | 29.15 | 32.07 | 3.81 (1)a | .052 | .015 | |
| 9. Wait Time | .155 | 15.08 (3,246) | <.001 | .155 | ||||
| See a counselor for the first time immediately, during office hours. | 63.09 | 17.39 | 72.18 | 20.37 | 7.86 (1) | .005* | .031 | |
| See a counselor for the first time after about 72 hours. | 23.16 | 12.60 | 37.63 | 14.56 | 38.83 (1) | <.001* | .135 | |
| See a counselor for the first time after about 1 month. | –36.98 | 16.24 | –46.70 | 17.85 | 11.49 (1) | .001* | .044 | |
| See a counselor for the first time after more than 1 month. | –49.27 | 20.23 | –63.10 | 22.09 | 15.17 (1) | <.001* | .058 | |
| 10. Location | .143 | 13.63 (3,246) | <.001 | .143 | ||||
| Building or office in the community that specializes in mental health services. | 53.16 | 14.61 | 39.42 | 18.54 | 22.14 (1) | <.001* | .082 | |
| Youth cafe and recreation centre. | 1.66 | 21.00 | 21.52 | 25.40 | 24.35 (1) | <.001* | .089 | |
| Hospital or doctor’s office. | –11.50 | 15.62 | –15.26 | 23.68 | 1.06 (1)a | .305 | .004 | |
| School setting. | –43.32 | 13.75 | –45.68 | 15.89 | .865 (1) | .353 | .003 | |
| 11. Engagement | .252 | 27.60 (3,246) | <.001 | .252 | ||||
| Youth and caregivers give feedback, e.g., anonymous surveys. | –2.72 | 15.04 | –10.92 | 16.90 | 9.18 (1) | .003* | .036 | |
| Youth and caregivers are on staff at the organization. | –18.67 | 14.67 | –0.49 | 14.38 | 59.61 (1) | <.001* | .194 | |
| Youth and caregivers are on an advisory group that gives feedback on services and evaluation. | 13.79 | 15.33 | 19.00 | 16.27 | 3.92 (1) | .049 | .016 | |
| Youth and caregivers play a leadership role in making decisions for the organization. | 7.60 | 15.56 | –7.59 | 16.77 | 31.61 (1) | <.001* | .113 | |
| 12. Information Sharing | .105 | 9.62 (3,246) | <.001 | .105 | ||||
| No sharing of personal information with caregivers. | –103.90 | 22.66 | –89.96 | 26.54 | 10.89 (1) | .001* | .042 | |
| All personal information is available to caregivers, with youth consent. | 31.10 | 26.75 | 27.19 | 31.00 | .628 (1) | .429 | .003 | |
| Service provider decides what information to share with caregivers, with youth consent. | 12.48 | 20.43 | 15.04 | 24.43 | .437 (1) | .509 | .002 | |
| Youth and service provider work together to decide what personal information to share with caregivers and how that can be helpful. | 60.32 | 13.52 | 47.73 | 17.89 | 20.14 (1) | <.001* | .075 | |
[i] a Levene’s test of equality of error variance statistically significant.
* Statistically significant at the Bonferroni corrected p-value of .0125.
Table 5
Randomized first choice simulation results of each caregiver group’s ideal IYS scenario, with standard errors and 95% confidence intervals.
| CAREGIVERS OF JUSTICE-INVOLVED YOUTH n = 46 | CAREGIVERS OF NON-JUSTICE-INVOLVED YOUTH n = 204 | |||||
|---|---|---|---|---|---|---|
| SHARES OF PREFERENCE | SE | 95% CI | SHARES OF PREFERENCE | SE | 95% CI | |
| Scenario 1 | 25.1% | 4.5% | 16.2%–33.9% | 51.6% | 2.7% | 46.4%–56.9% |
| Scenario 2 | 74.9% | 4.5% | 66.1%–83.8% | 48.4% | 2.7% | 43.1%–53.6% |
[i] SE = Standard Error.
CI = 95% Confidence Interval.
Scenario 1 refers to when the most preferred level of caregivers of non-justice-involved is implemented across all 12 attributes.
Scenario 2 refers to when the most preferred level of caregivers of justice-involved is implemented across all 12 attributes.