
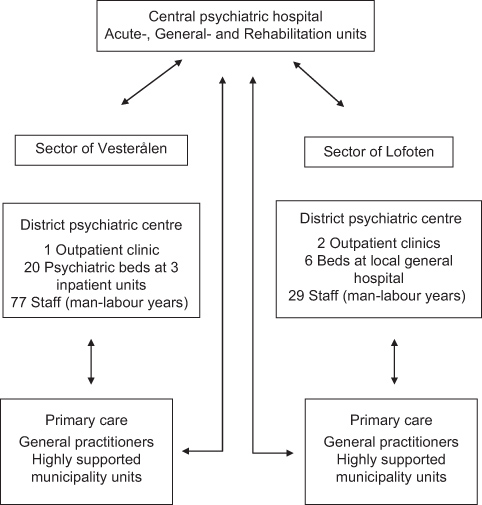
Figure 1.
Outline of the psychiatric services in the two sectors of Vesterålen and Lofoten, County of Nordland, Norway.
Table 1.
Characteristics of catchment areas for the sectors of Vesterålen and of Lofoten, County of Nordland, Norway
| Variable | Sector of Vesterålen | Sector of Lofoten | |||
| Geography | Distance to central psychiatric hospital over land (km) | 329.6 | 457.2 | ||
| Travel time by air (min) | 30 | 25 | |||
| Size (square km) | 2510.6 | 1197.3 | |||
| Infrastructure | Municipalities | 5 | 4 | ||
| Cities | 2 | 2 | |||
| Airports | 2 | 2 | |||
| Larger harbours | 2 | 2 | |||
| Catchment area demographics | Persons aged 18–65 | 18,212 | 13,417 | ||
| Gender | Male | Female | Male | Female | |
| Young2 | 2082 (11.4%) | 1899 (10.4%) | 1641 (12.2%) | 1474 (11.0%) | |
| Middle aged | 4111 (22.6%) | 3989 (22.0%) | 3029 (22.6%) | 2916 (21.7%) | |
| Elderly | 3147 (17.3%) | 2984 (16.4%) | 2285 (17.0%) | 2072 (15.4%) | |
| Sum | 9340 (51.3%) | 8872 (48.7%) | 6955 (51.8%) | 6462 (48.2%) | |
| Population density (persons per square km) | 12.1 | 18.7 | |||
[i] 1Year of 2005 by Statistics Norway [27].
2Young: 18–29, middle aged: 30–49, elderly: 50–65.
Table 2.
Utilization pattern for patients in a decentralized care versus a partly centralized care model of psychiatric services. One-year registered prevalence sample (2005)
| Study area/Service-system | Lofoten/Partly centralized care model | Vesterålen/Decentralized care model | |||
| Category of patients | Total patient population | Patients with at least one inpatient stay | Total patient population | Patients with at least one inpatient stay | |
| Number of patients | 546 | 106 | 716 | 141 | |
| Gender | |||||
| Male | 231 | 47 | 284 | 64 | |
| Female | 315 | 59 | 432 | 77 | |
| Age (mean) | 38.2 (sd=11.9) | 41.0 (sd=12.5) | 38.6 (sd=12.2) | 40.7 (sd=13.3) | |
| Length of inpatient stays (in days, median) | … | 10* | … | 20* | |
| Outpatient consultations (median) | 4* | 5* | 3* | 7* | |
| Patients (n) receiving outpatient consultations | 484 (88.2%)** | 54 (50.9%)** | 679 (94.3%)** | 115 (81.6%)** | |
[i] *p<0.05, **p<0.01, when service-models were compared.
Table 3.
Logistic regression model of inpatients’ utilization of outpatient care
| Variable | B | Sig. | OR | 95% CI |
| Gender | 0.236 | 0.474 | 1.266 | 0.663–2.417 |
| Age | –0.009 | 0.470 | 0.991 | 0.967–1.016 |
| Substance abuse disorders | –0.342 | 0.566 | 0.711 | 0.221–2.282 |
| Psychotic disorders | –0.444 | 0.449 | 0.641 | 0.203–2.027 |
| Affective disorders | 0.336 | 0.551 | 1.399 | 0.463–4.227 |
| Anxiety disorders | –0.479 | 0.381 | 0.619 | 0.212–1.808 |
| Length of inpatient stay | 0.827 | 0.003 | 2.286 | 1.323–3.951 |
| Type of service system | 1.120 | 0.001 | 3.065 | 1.555–6.044 |
| Local admission only | –0.310 | 0.626 | 0.733 | 0.210–2.555 |
| Central admission only | –1.526 | 0.011 | 0.217 | 0.067–0.705 |
| Constant | 0.315 | 0.721 | 1.370 |