
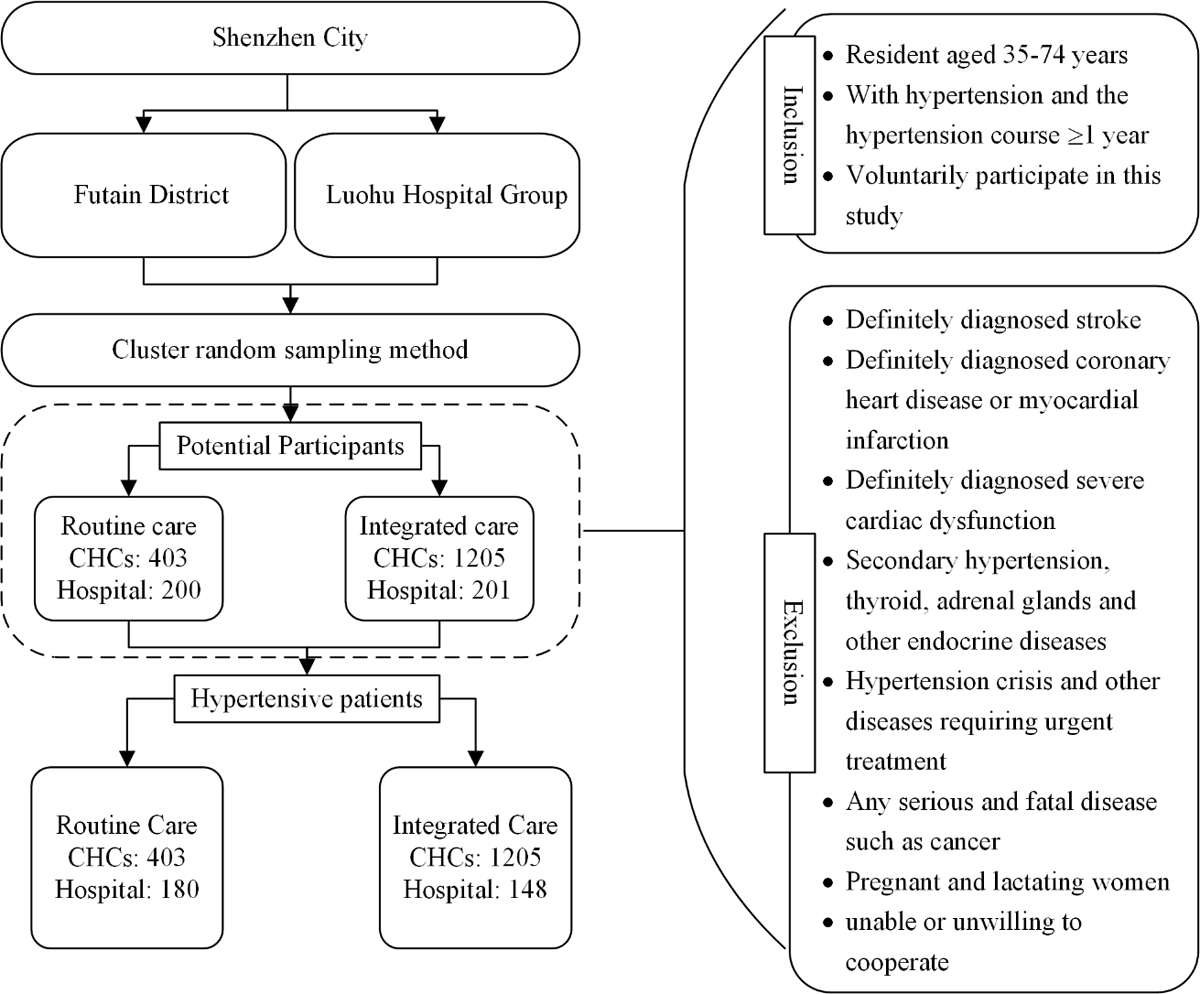
Figure 1
Flow chart of the recruitment plan for hypertensive patients in routine care communities and integrated care communities.
Note: CHC: community health centre.
Table 1
Comparison of basic and clinical characteristics of participants with hypertension from the integrated care and the routine care communities.
| CHARACTERISTICS | ROUTINE CARE COMMUNITIES | INTEGRATED CARE COMMUNITIES | χ2/Z | P |
|---|---|---|---|---|
| Sociodemographic | ||||
| Men, n (%) | 346 (59.35) | 746 (55.14) | 2.939 | 0.087 |
| Age, year | 58.5 (50–66) | 57.0 (49–64) | 2.749 | 0.006 |
| Education, n (%) | 1.432 | 0.489 | ||
| Middle school or below | 245 (42.39) | 558 (41.27) | ||
| High school | 192 (33.22) | 486 (35.95) | ||
| College degree or above | 141 (24.39) | 308 (22.78) | ||
| Married/Cohabitating, n (%) | 528 (90.88) | 1251 (92.53) | 1.512 | 0.219 |
| Occupation, n (%) | 1.927 | 0.588 | ||
| Worker | 36 (6.02) | 106 (7.84) | ||
| Salaried employee | 144 (24.78) | 336 (24.85) | ||
| Self-employed | 45 (7.75) | 111 (8.21) | ||
| Retiree or other | 356 (61.27) | 799 (59.10) | ||
| Current drinker, n (%) | 154 (26.46) | 344 (25.44) | 0.220 | 0.639 |
| Current smoker, n (%) | 191 (32.76) | 394 (29.12) | 2.562 | 0.110 |
| Household income per capita, Ұ/month, n (%) | 8.344 | 0.015 | ||
| ≤5000 | 283 (61.79) | 706 (57.21) | ||
| 5001–10000 | 133 (29.04) | 350 (28.36) | ||
| >10000 | 42 (9.17) | 178 (14.42) | ||
| Medical insurance, n (%) | 22.71 | <0.0001 | ||
| First grade | 358 (61.41) | 767 (56.69) | ||
| Second grade | 83 (14.24) | 192 (14.19) | ||
| Third grade | 32 (5.49) | 44 (3.25) | ||
| Self-paying or other | 110 (18.87) | 350 (25.87) | ||
| The usual source of care, n (%) | 28.154 | <0.0001 | ||
| CHCs | 458 (79.38) | 1157 (85.64) | ||
| Public hospital | 76 (13.17) | 161 (11.92) | ||
| Private hospital or other | 43 (7.45) | 33 (2.44) | ||
| Clinical | ||||
| Comorbidity status, n (%) | 261 (44.77) | 569 (42.05) | 1.225 | 0.268 |
| BMI, kg/m2 | 25.8 (23.6–27.9) | 25.6 (23.7–27.8) | 0.364 | 0.716 |
| WC, cm | 90.6 (84.4–96.5) | 90.0 (83.6–95.7) | 1.948 | 0.051 |
| SBP, mmHg | 136.0 (127.0–146.0) | 137.0 (127.3–147.3) | –0.970 | 0.332 |
| DBP, mmHg | 82.0 (77.3–97.3) | 84.3 (77.3–91.0) | –1.483 | 0.138 |
| FPG, mmol/L | 5.9 (5.4–6.7) | 5.6 (5.2–6.3) | 5.407 | <0.0001 |
| With diabetes | 7.3 (6.2–8.9) | 7.2 (6.4–8.2) | 0.914 | 0.361 |
| Without diabetes | 5.7 (5.3–6.2) | 5.4 (5.1–5.9) | 5.735 | <0.0001 |
| Scr, umol/L | 68.0 (57.5–80.0) | 67.0 (56.0–78.0) | 1.618 | 0.106 |
| UA, umol/L | 352 (300–419) | 354 (298–422) | –0.209 | 0.835 |
| TC, mmol/L | 5.1 (4.4–5.9) | 5.0 (4.3–5.7) | 1.583 | 0.114 |
| TG, mmol/L | 1.4 (1.0–2.1) | 1.4 (1.0–2.0) | 1.117 | 0.264 |
| HDL-C, mmol/L | 1.2 (1.0–1.4) | 1.2 (1.0–1.4) | 0.386 | 0.699 |
| ALT, IU/L | 18.5 (13.0–26.0) | 20.0 (15.0–29.0) | –3.798 | 0.0001 |
| AST, IU/L | 22.0 (19.0–26.0) | 22.0 (19.0–26.0) | –0.694 | 0.488 |
[i] Notes:
a) P was calculated by chi-square test (categorical variables) and Wilcoxon test (continuous variables);
b) Continuous variables are presented as medians (25th–75th percentile);
c) CHCs: community health centre; ALT: alanine transferase; AST: aspartate transferase; BMI: body mass index; DBP: diastolic blood pressure; FPG: fasting plasma glucose; HDL-C: high density lipoprotein cholesterol; SBP: systolic blood pressure; Scr: serum creatinine; TC: total cholesterol; TG: triglyceride; UA: uric acid; WC: waist circumference.
Table 2
Hypertension management and control in the integrated care and the routine care communities.
| HYPERTENSION MANAGEMENT AND CONTROL | ROUTINE CARE COMMUNITIES | INTEGRATED CARE COMMUNITIES | χ2/Z | P | |
|---|---|---|---|---|---|
| Hypertension management | |||||
| Standardized management, n (%) | 82 (14.07) | 619 (45.75) | 177.09 | <0.0001 | |
| Medication compliance, n (%) | |||||
| Participants with standardized management | Non-compliance* | 9 (12.00) | 13 (2.15) | 23.249 | <0.0001 |
| Occasional compliance | 2 (2.67) | 54 (8.94) | |||
| Complete compliance | 64 (85.33) | 537 (88.91) | |||
| Participants without standardized management | Non-compliance | 38 (7.98) | 44 (6.32) | 2.461 | 0.292 |
| Occasional compliance | 54 (11.34) | 96 (13.79) | |||
| Complete compliance | 384 (80.67) | 556 (79.89) | |||
| Mean BP level and hypertension control rate | |||||
| All participants | SBP, mmHg | 137.3 ± 16.0 | 138.0 ± 15.6 | –1.194 | 0.232 |
| DBP, mmHg | 83.8 ± 11.2 | 84.3± 10.7 | –1.483 | 0.138 | |
| Age-standardized control rate, % (95% CI) | 52.65 (46.54–58.77) | 50.30 (46.49–54.10) | 0.650 | 0.518 | |
| Comorbidity status | |||||
| Yes | SBP, mmHg | 137.0 ± 15.5 | 136.5 ± 15.6 | 0.233 | 0.816 |
| DBP, mmHg | 82.2 ± 10.8 | 82.3 ± 10.7 | –0.043 | 0.966 | |
| Age-standardized control rate, % (95% CI) | 56.62 (46.30–66.94) | 52.76 (46.69–58.82) | 0.640 | 0.521 | |
| No | SBP, mmHg | 137.5 ± 16.4 | 139.1 ± 15.5 | –1.641 | 0.101 |
| DBP, mmHg | 84.9 ± 11.4 | 85.7 ± 10.5 | –1.697 | 0.090 | |
| Age-standardized control rate, % (95% CI) | 50.99 (43.04–58.94) | 48.81 (43.85–53.76) | 0.460 | 0.645 | |
| Gender | |||||
| Men | SBP, mmHg | 136.6 ± 15.6 | 137.8 ± 14.9 | –1.220 | 0.223 |
| DBP, mmHg | 85.1 ± 11.4 | 86.6 ± 10.1 | –2.484 | 0.013 | |
| Age-standardized control rate, % (95% CI) | 50.89 (43.07–58.71) | 47.69 (42.58–52.80) | 0.680 | 0.496 | |
| Women | SBP, mmHg | 138.2 ± 16.5 | 138.2 ± 16.3 | –0.345 | 0.730 |
| DBP, mmHg | 81.9 ± 10.8 | 81.4 ± 10.7 | 0.140 | 0.889 | |
| Age-standardized control rate, % (95% CI) | 55.37 (44.61–66.13) | 54.36 (48.29–60.44) | 0.160 | 0.873 | |
[i] Notes:
a) SBP: systolic blood pressure; DBP: diastolic blood pressure; 95% CI: 95% confidence interval;
b) Variables are mean ± standard deviation unless otherwise indicated;
c) P for hypertension management was calculated by chi-square test, P for SBP/DBP and age-standardized control rate of hypertension was calculated by Wilcoxon test and z-test;
d) * P < 0.0001, Bonferroni-adjusted inspection level of α = 0.0167.
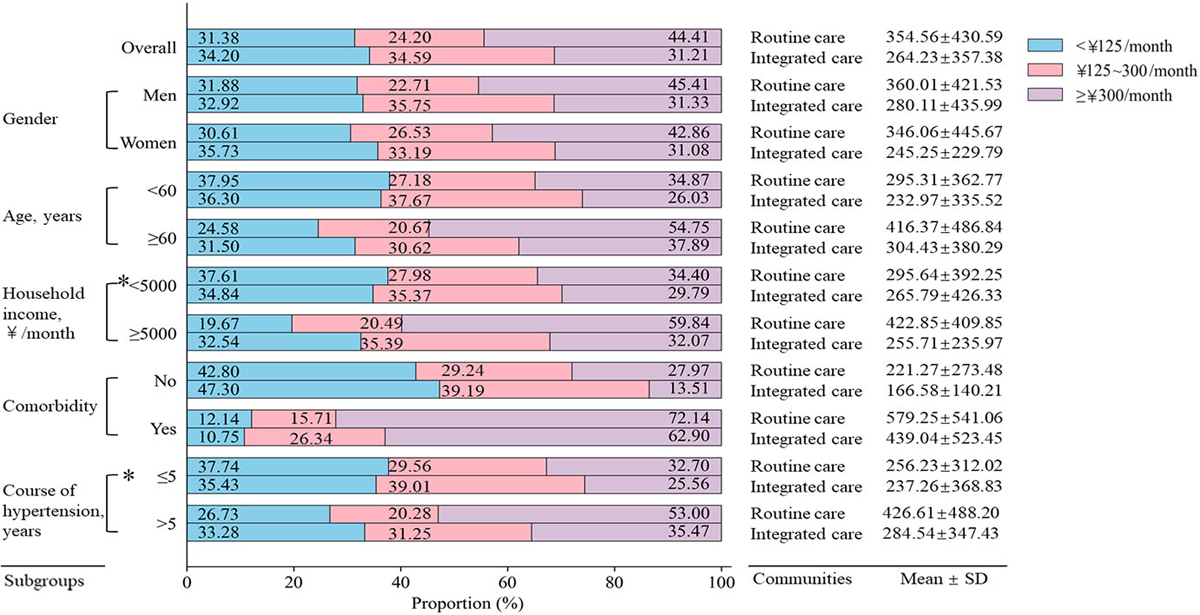
Figure 2
The monthly pharmaceutical expenditure on hypertension and its comorbidities per capita in the integrated care and the routine care communities.
P was calculated by Chi-square test, and all P < 0.05, except for *.
Table 3
The Knowledge, attitude, and practice scores towards cardiovascular diseases of participants with hypertension from the integrated care and the routine care communities.
| KAP scores | Routine care communities | Integrated care communities | t values | P |
| All participants | ||||
| Knowledge score | 29.83 ± 8.92 | 32.10 ± 6.35 | –5.580 | <0.0001 |
| Attitude score | 20.33 ± 5.56 | 21.76 ± 4.36 | –5.530 | <0.0001 |
| Practice score | 18.73 ± 4.53 | 19.61 ± 4.37 | –4.000 | <0.0001 |
| Total score | 68.89 ± 15.51 | 73.48 ± 11.54 | –6.430 | <0.0001 |
| Participants with standardized management | ||||
| Knowledge score | 29.32 ± 9.25 | 32.64 ± 5.58 | –3.180 | 0.002 |
| Attitude score | 20.55 ± 5.58 | 22.24 ± 3.84 | –2.660 | 0.009 |
| Practice score | 20.03 ± 3.98 | 20.99 ± 3.58 | –2.080 | 0.040 |
| Total score | 69.90 ± 15.46 | 75.88 ± 9.52 | –3.420 | 0.001 |
| Participants without standardized management | ||||
| Knowledge score | 29.91 ± 8.88 | 31.65 ± 6.90 | –3.690 | 0.0002 |
| Attitude score | 20.29 ± 5.56 | 21.36 ± 4.71 | –3.520 | 0.0004 |
| Practice score | 18.51 ± 4.58 | 18.45 ± 4.63 | 0.230 | 0.814 |
| Total score | 68.72 ± 15.52 | 71.47 ± 12.66 | –3.280 | 0.001 |
[i] Notes:
a) P was calculated by T test;
b) Variables are mean ± standard deviation;
c) KAP: knowledge, attitude, and practice.

Figure 3
Patients’ satisfaction with health service delivery in the routine care (A) and the integrated care communities (B). P was calculated by χ2 test to compare the difference of 5-point satisfaction between routine care (A) and integrated care communities (B). And all P values were < 0.0001.