
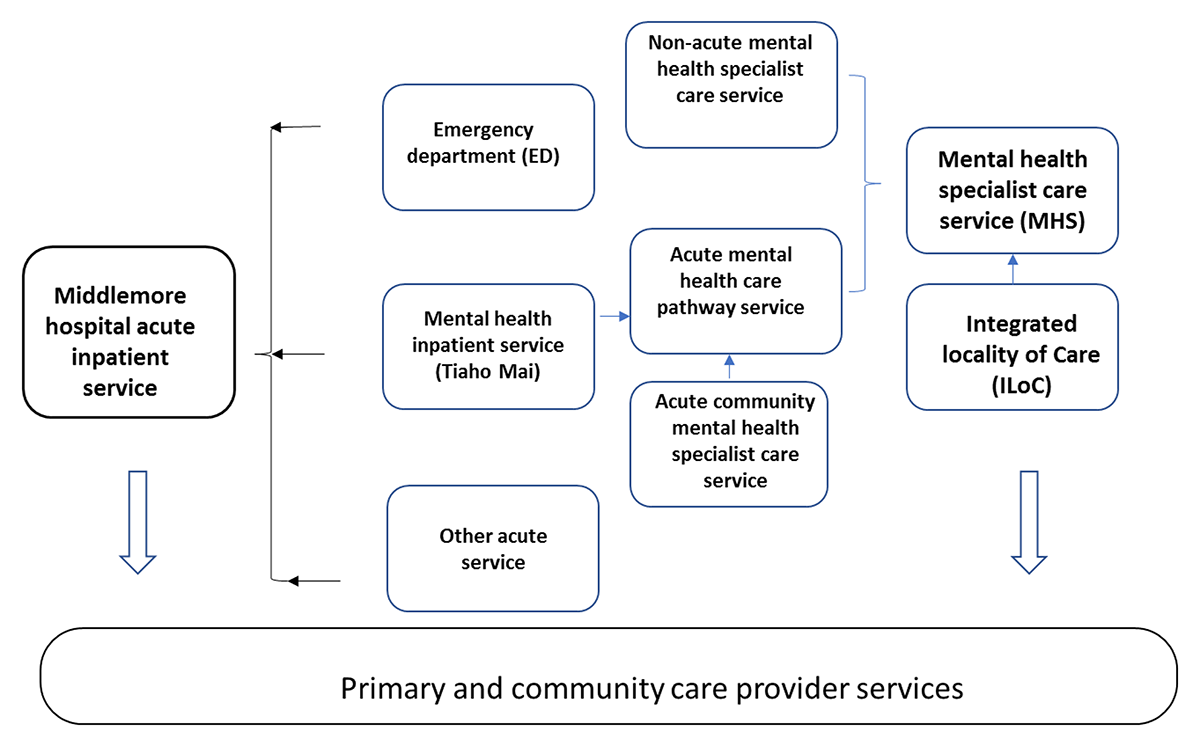
Figure 1
The operational structure of Mental health specialist services and Emergency department.
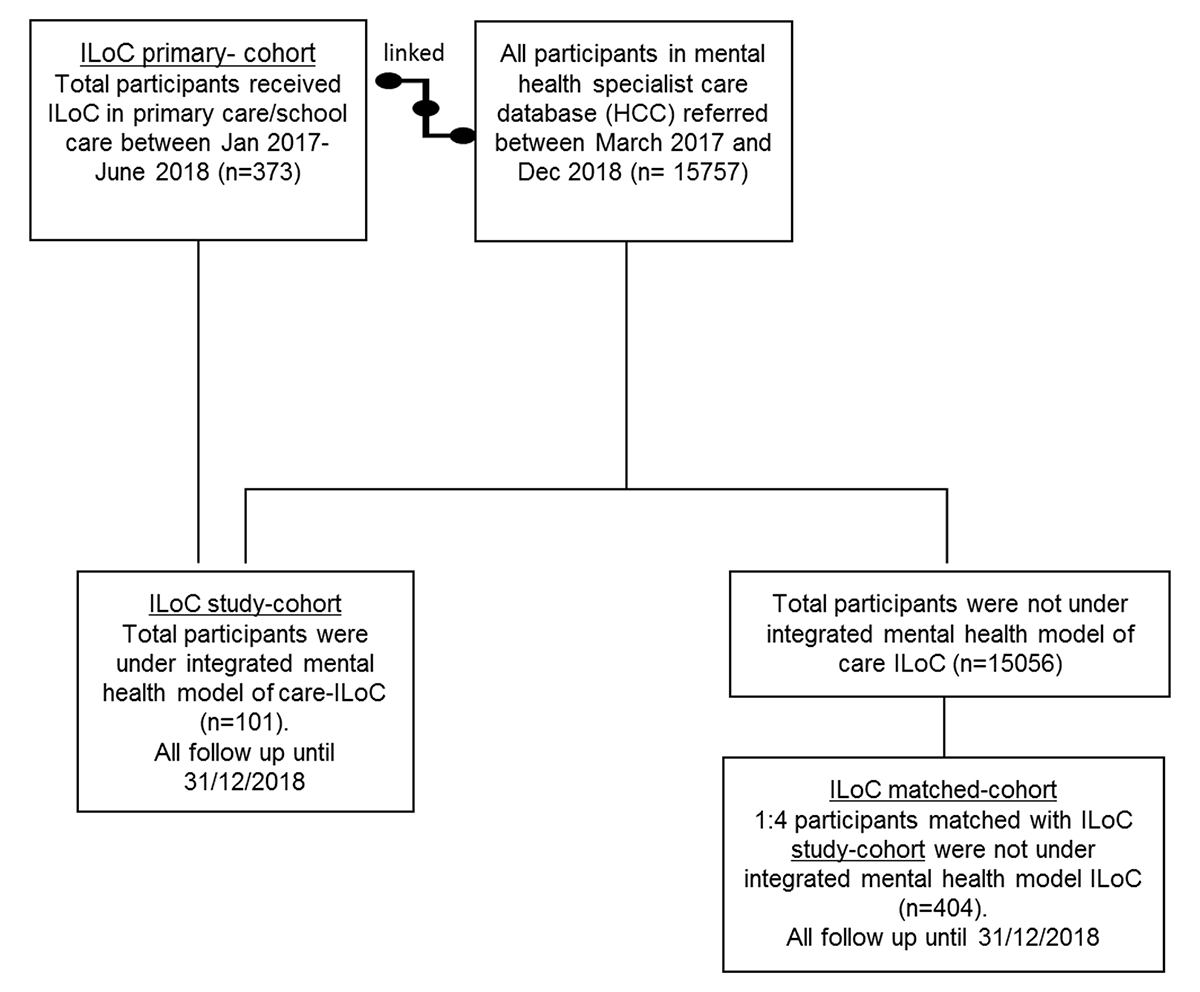
Figure 2
The study participants flow chart.
Table 1
Demographics of the three cohorts.
| PRIMARY ILOC COHORT | ILOC STUDY-COHORT | MATCHED-COHORT | P VALUE OF COMPARING ILOC STUDY VS. MATCHED-COHORTS | |
|---|---|---|---|---|
| n = 373 | n = 101 | n = 404 | ||
| Age (mean (std)) | 48 (29) | 41 (28) | 41 (26) | 0.86† |
| Age groups | ||||
| 0–19 | 113 (30.3%) | 37 (36.6%) | 148 (36.6%) | |
| 20–29 | 33 (8.9%) | 9 (8.9%) | 36 (8.9%) | |
| 30–39 | 24 (6.4%) | 8 (7.9%) | 36 (8.9%) | |
| 40–49 | 27 (7.2%) | 9 (8.9%) | 32 (7.9%) | |
| 50–64 | 43 (11.5%) | 11 (10.9%) | 44 (10.9%) | |
| 65 and over | 133 (35.7%) | 27 (26.7%) | 108 (26.7%) | |
| Gender | ||||
| Female | 218 (58.5%) | 66 (65.4%) | 269 (66.7%) | |
| Male | 155 (41.6%) | 35 (34.7%) | 135 (33.4%) | 0.81§ |
| Ethnicity | ||||
| Asian | 25 (6.7%) | 9 (8.9%) | 16 (3.9%) | |
| European | 281 (75.3%) | 69 (68.3%) | 295 (73.0%) | |
| Maaori | 53 (14.2%) | 20 (19.8%) | 85 (21.0%) | |
| Other | 8 (2.1%) | 1 (1.0%) | 0 (0%) | |
| Pacific | 6 (1.6%) | 2 (2.0%) | 8 (2.0%) | 0.10§ |
| Born in New Zealand | ||||
| No | 75 (20.1%) | 19 (18.8%) | 50 (12.4%) | |
| Unknown | 13 (3.5%) | 0 | 11 (2.7%) | |
| Yes | 285 (76.4%) | 82 (81.2%) | 343 (84.9%) | 0.47§ |
| Deprivation score | ||||
| mean (std) | 5 (3) | 5 (3) | 6 (3) | 0.17$ |
| Distance (km) to hospital (median (IQR)) | 24.6 (9.6, 29.4) | 22.7 (9.4, 29.4) | 9.6 (6.4, 14.6) | <0.0001# |
[i] † Analysis of variance.
# Kolmogorov-Smirnov two sample tests (empirical distribution test).
§ Chi square test or fisher exact test.
Table 2
Clinical profile of study-cohort and matched-cohort.
| ILOC STUDY-COHORT | MATCHED-COHORt | P VALUE# | |
|---|---|---|---|
| Referral for first specialist episode was from GP | 47 (46.5%) | 184 (45.5%) | 0.86 |
| N = 101 | N = 404 | ||
| Medication profile post first referral | |||
| ADHD | 0 (0%) | 9 (6.9%) | |
| Benztropine | 2 (2.0%) | 3 (2.3%) | 0.52 |
| Antidepressant | 22 (21.8%) | 77 (19.1%) | 0.53 |
| Antipsychotic | 25 (24.8%) | 72 (17.8%) | 0.11 |
| Hypnotic | 12 (11.9%) | 33 (8.2%) | 0.24 |
| Mood stabilization | 8 (7.9%) | 13 (3.2%) | 0.03* |
| Anxiolytic | 14 (13.9%) | 30 (7.4%) | 0.04* |
| Previous suicide attempts 1 year before Jan 2017 | 6 (5.9%) | 14 (3.5%) | 0.39 |
| Have previous ED and inpatient wards admission | 43 (42.6%) | 154 (38.1%) | 0.48 |
[i] # Chi square or fisher exact test.
Table 3
MH&A Length of care/stay.
| DATA PRESENTED ARE DAYS | ILOC STUDY-COHORT | MATCHED-COHORT |
|---|---|---|
| no of admission episodes = 69 | no of admission episodes = 326 | |
| observed acute service length of care in days median (IQR) | 5 (1–10) | 5 (2–11) |
| no of admission episodes = 26 | no of admission episodes = 52 | |
| observed inpatients length of stay median (IQR) | 13 (5–26) | 12 (5.5–22.5) |
| no of admission episodes = 123 | no of admission episodes = 362 | |
| observed Non acute length of care median (IQR) | 66 (8–205) | 76 (18–189) |
| no of admission episodes = 218 | no of admission episodes = 740 | |
| observed all length of care in days (median (IQR)) | 14 (3–99) | 13 (4–76) |
Table 4
Length- of- care (days) in non-acute MHS – comparison between ILoC study and matched-cohort adjusted for confounding factors.
| ESTIMATED RATIO IN DAYS | CONFIDENCE INTERVAL | P VALUE | |
|---|---|---|---|
| study ILoC cohort vs. matched-cohort | 0.71 | 0.47–1.08 | 0.11 |
| Predisposing factors | |||
| Age at referral (each year increase) | 0.99 | 0.98–1.00 | 0.04* |
| ethnicity | |||
| Asian and others vs. European | 1.13 | 0.46–2.78 | 0.79 |
| Maaori and Pacific vs. European | 1.04 | 0.64–1.69 | 0.86 |
| Gender | |||
| Female vs. Male | 1.09 | 0.75–1.57 | 0.66 |
| Born in NZ (Yes vs. No) | 0.95 | 0.48–1.88 | 0.89 |
| Enabling factors | |||
| deprivation index | 1.03 | 0.97–1.11 | 0.31 |
| Clinical needs factors | |||
| Antidepressant (Yes vs. No) | 1.67 | 1.06–2.65 | 0.03* |
| Antipsychotic (Yes vs. No) | 1.31 | 0.78–2.20 | 0.30 |
| Hypnotic (Yes vs. No) | 0.62 | 0.30–1.31 | 0.21 |
| mood stabilization (Yes vs. No) | 0.90 | 0.41–1.95 | 0.78 |
| anxiolytic (Yes vs. No) | 1.75 | 0.80–3.82 | 0.16 |
Table 5
Admissions to acute MHS -comparison between ILoC cohort and matched-cohort adjusted for confounding factors.
| HAZARD RATIO | 95% CONFIDENCE INTERVAL | P VALUE | |
|---|---|---|---|
| Study group (study ILoC cohort vs. matched-cohort) | 0.75 | 0.54 – 1.03 | 0.08 |
| Age at referral | 1.00 | 1.00 – 1.01 | 0.34 |
| ethnicity | |||
| Asian and Other vs. European | 1.18 | 0.66 – 2.12 | 0.58 |
| Māori and Pacific vs. European | 1.14 | 0.84 – 1.56 | 0.40 |
| Gender | |||
| Female vs. Male | 1.13 | 0.85 – 1.50 | 0.42 |
| Born in NZ (No verse Yes) | 0.77 | 0.47 – 1.26 | 0.30 |
| Deprivation index | 1.10 | 1.05 – 1.15 | <0.0001* |
| antidepressant (Yes vs. No) | 1.48 | 1.11 – 1.98 | 0.007* |
| Antipsychotic (Yes vs. No) | 1.61 | 1.19 – 2.17 | 0.002* |
Table 6
First MHS episode after ILoC intervention in ILoC study-cohort compared to matched-cohort.
| ILOC STUDY-COHORT | ILOC MATCHED-COHORT | P VALUE | |
|---|---|---|---|
| Count (%) | Count (%) | ||
| n = 101‡ | n = 404‡ | ||
| Acute admission | 35 (34.7%) | 199 (49.3%) | |
| Inpatient admission | 6 (5.9%) | 21 (5.2%) | |
| Non-acute admission | 60 (59.4%) | 184 (45.5%) | 0.03* |
[i] ‡ Number of participants.
Table 7
Acute admission in the first MHS episode after ILoC intervention – adjusted for confounding factors.
| ODDS RATIO | CONFIDENCE INTERVAL | P VALUE | ||
|---|---|---|---|---|
| study ILoC cohort vs. matched-cohort | 0.52 | 0.32 | 0.85 | 0.009* |
| Predisposing factors | ||||
| Age at referral (each year increase) | 1.01 | 1.002 | 1.02 | 0.01* |
| ethnicity | ||||
| Asian and others vs. European | 1.40 | 0.55 | 3.53 | 0.48 |
| Maaori and Pacific vs. European | 1.69 | 1.01 | 2.83 | 0.05* |
| Gender | ||||
| Female vs. Male | 1.74 | 1.15 | 2.61 | 0.008* |
| Born in NZ (Yes vs. No) | 1.48 | 0.77 | 2.87 | 0.24 |
| Enabling factors | ||||
| deprivation index | 1.16 | 1.09 | 1.25 | <.0001* |
| Clinical needs factors | ||||
| Antidepressant (Yes vs. No) | 1.69 | 1.03 | 2.77 | 0.04* |
| Antipsychotic (Yes vs. No) | 2.54 | 1.52 | 4.26 | 0.0004* |