
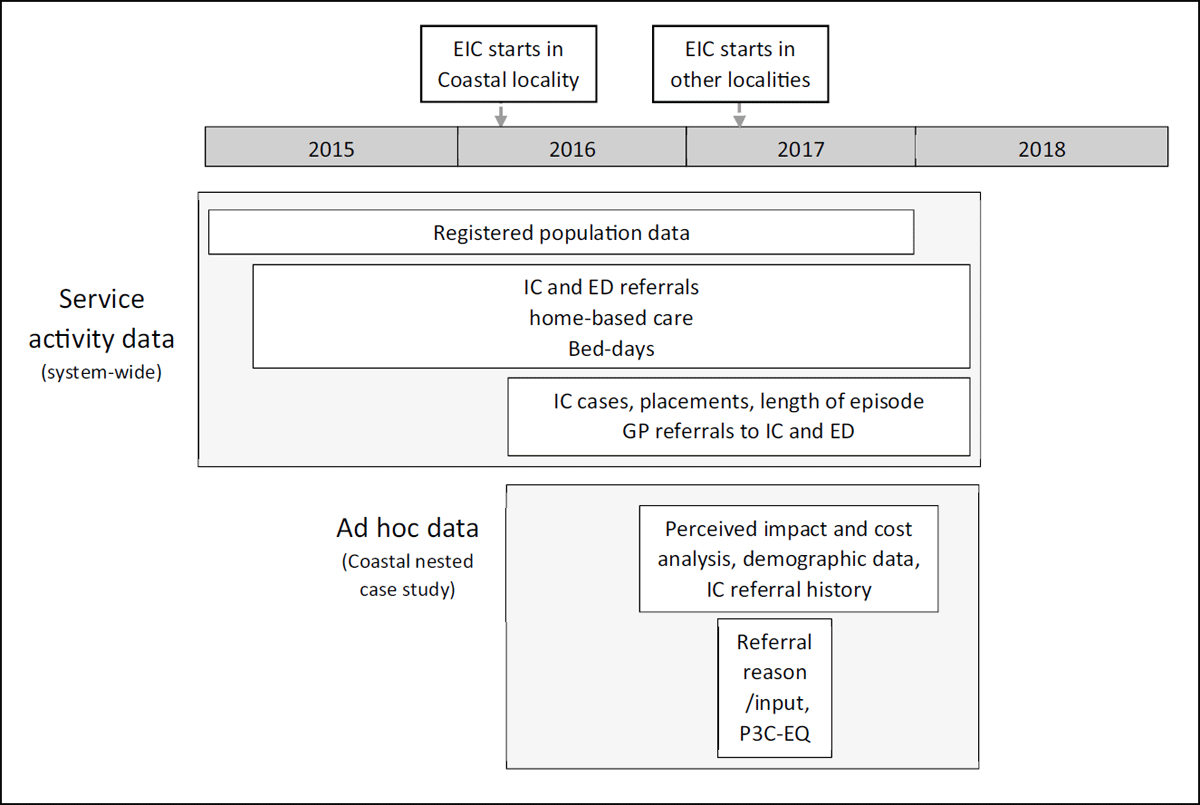
Figure 1
Data collection and time frames.
Table 1
Estimated unit costs of service use perceived to have been prevented by EIC.
| INTERVENTIONS PERCEIVED TO HAVE BEEN PREVENTED | UNIT COST |
|---|---|
| Acute hospital admission [37] | £ 1,590 |
| Emergency Department attendance [37] | £ 148 |
| Pro-active hospital discharge [37] | £ 313 |
| Emergency & 999 call [37] | £ 7 |
| Out-of-hours GP visit [38] | £72 |
| GP telephone consultation [39] | £14 |
| Residential/nursing home admissionα[39] | £155 |
| Adult Social care visit (1 hour) [39] | £40 |
| Out-of-hours nursing visit [40] | £31 |
| Community hospital admission [41] | £140 |
| Intermediate careβ [37] | £131 |
[i] Key: GP = general practitioner.
α: Based on the NHS contribution to a one-day admission, so it is a conservative estimate.
β: Estimated by summing weighted national reference costs for crisis response, home and bed-based care services.
Table 2
Summary of the population size, level of service integration and degree of implementation of the new care model across all five localities between 2016 and 2017.
| DEMOGRAPHICS AND CHARACTERISTICS OF EIC BY LOCALITY | 2015 | 2016 | ||||||||
|---|---|---|---|---|---|---|---|---|---|---|
| COASTAL | MOOR TO SEA | NEWTON ABBOTT | PAIGNTON & BRIXHAM | TORQUAY | COASTAL | MOOR TO SEA | NEWTON ABBOTT | PAIGNTON & BRIXHAM | TORQUAY | |
| Area description | Towns/rural | Towns/rural | Towns | Urban/sub-urban | Urban/sub-urban | Town/rural | Towns/rural | Towns | Urban/sub-urban | Urban/sub-urban |
| Registered GP population size ≥70 years | 7,289 | 6,179 | 11,170 | 14,329 | 11,110 | 7,589 | 6,434 | 11,697 | 14,976 | 11,510 |
| Proportion of the population ≥70 years | 20.4% | 17.1% | 16.6% | 19.6% | 15.4% | 21.1% | 17.7% | 17.1% | 20.3% | 15.9% |
| Joint management of HSC team | Yes | Yes | Yes | Yesα | Yesα | Yes | Yes | Yes | Yesαα | Yesα |
| Joint budgets for HSC teamβ | Yes | Yes | Yes | Yesβ | Yesβ | Yes | Yes | Yes | Yesββ | Yesβ |
| Single daily MDT | Yes | No | No | No | No | Yes | Yes | Yes | Yes – two | Yes – two |
| Single referral process/point of contactγ | Noγ | Noγ | Noγ | Yes | Yes | Noγγ | Noγ | Noγ | Yes | Yes |
| Integrated health and social care IT recordsδ | No | No | No | Yes | Yes | No | No | No | Yes | Yes |
| Write access to GP recordsɛ | Yes | No | No | No | No | Yes | No | No | No | No |
| Heath and social care coordinator | Yes | Yes | Yes | Yes | Yes | Yes | Yes | Yes | Yes | Yes |
| Social worker input daily into MDT | Yes | Yes | Yes | Yes | Yes | Yes | Yes | Yes | Yes | Yes |
| GP input daily into MDT | Yes | No | No | No | No | Yes | Yesζ | No | Yesθ | No |
| Pharmacy input daily into MDT | Yesι | No | No | No | No | Yes | No | No | No | Yes |
| Voluntary sector input daily into MDT | Yesκ | No | No | No | No | Yes | No | No | No | No |
| Community MH input daily into MDT | Yesλ | No | No | Yes | Yes | Yes | No | No | Yes | Yes |
| Other input daily into MDT | No | No | No | No | No | No | Yes | Yesη | No | No |
| Community hospital-bed reductions/closures | Yes | No | No | No | NA | Yes | Yes | Yes | Yes | NA |
[i] KEY: EIC = Enhanced Intermediate Care; GP = General practice/practitioner; HSC = Health and social care; MDT = Multi-disciplinary meeting; IT = Information Technology.
Note:
α Since 2002 and then formerly in 2005 with the creation of Torbay Care Trust
β Aligned budgets while building towards Section 75 agreements
γ Social services and health service have a different Single Point Of Contact (SPOC)
δ Integrated community health and social care notes recorded on PARIS
ɛ Write access but only through the attending GP (not the whole team). Other areas had read access only.
ζ Visimeet audio-visual system introduced in 2018
η Paramedic started in 2018. Community matron only twice a week.
Θ Attends MDT twice a week in the morning (2 P.A.s)
ι Attends MDT four times a week in the morning (4 P.A.s)
κ Two alternating Well-being Coordinators five times a week (5 P.A.s)
λ Community Mental Health Nurse once a week.
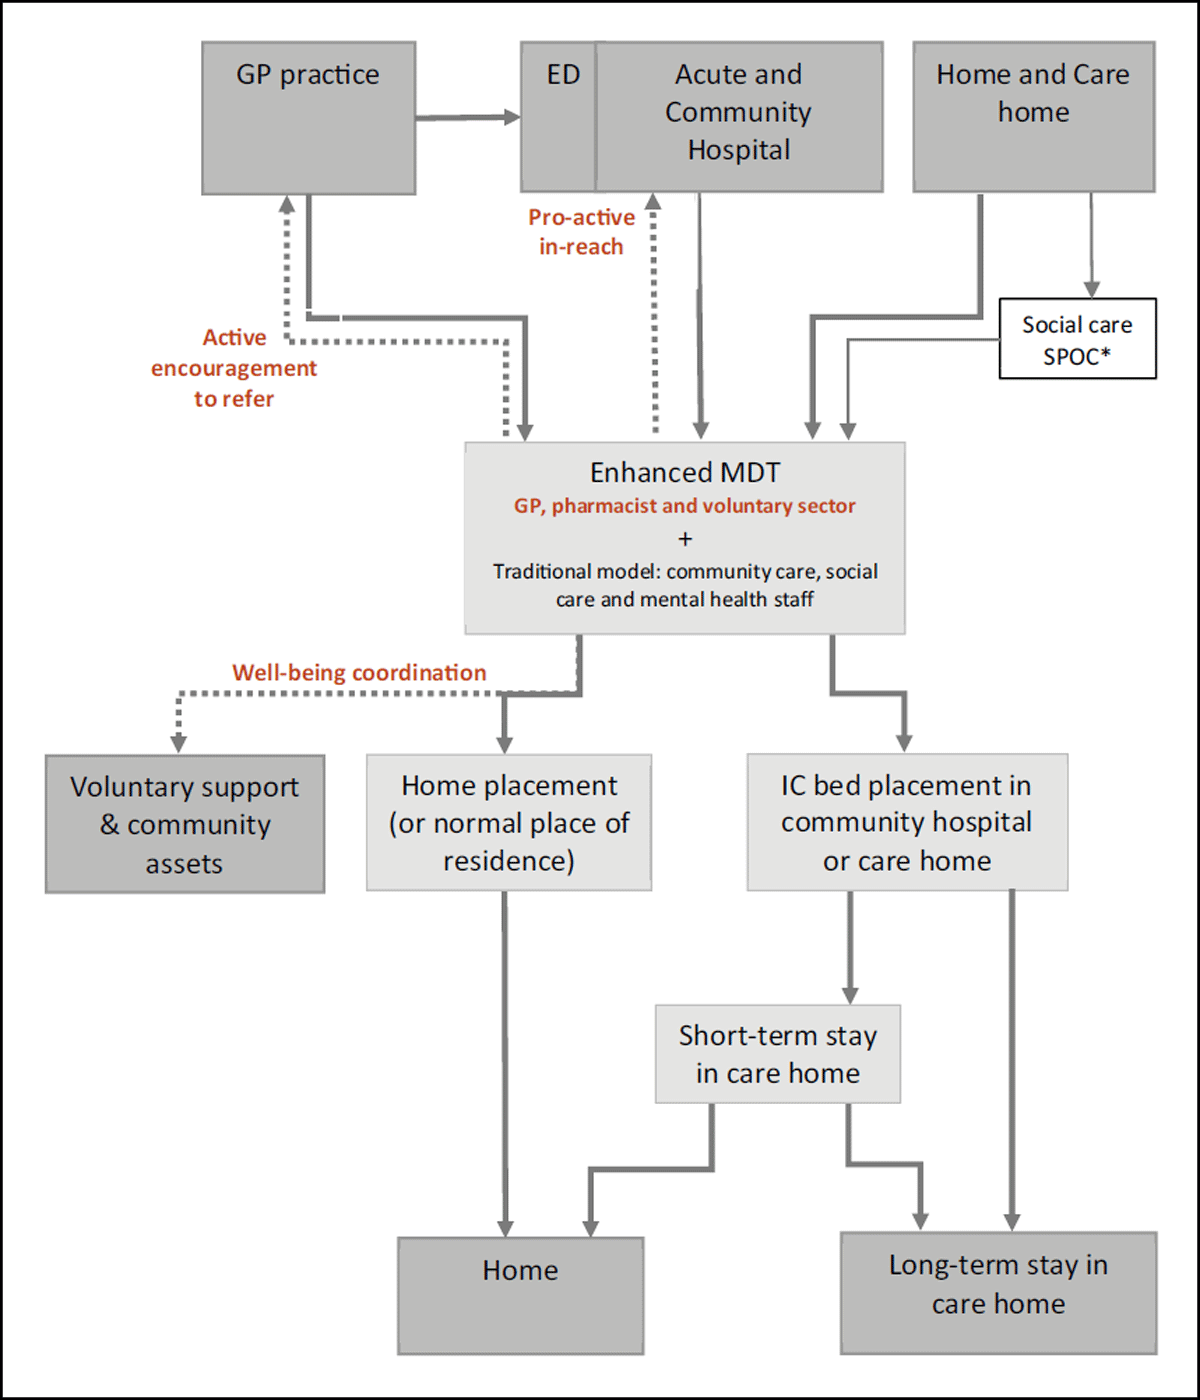
Figure 2
Intermediate care referral pathways, including the ‘enhanced’ pathway in Coastal locality.
Key: The enhanced elements of IC are marked in bold, brown text and new pathways shown with dotted lines. The solid lines are pathways that are present in both EIC and IC. ED is emergency department.
* South Devon localities also receive referrals from social care’s single point of contact (SPOC) service. Torbay localities have a combined health and social care SPOC.
Table 3
Population size (≥70 years), rates per ≥70 year-old population and percentage change in rates by year.
| LOCALITY | POPULATION SIZE | EIC REFERRAL RATES (95% CI) | % CHANGE IN RATES | |||||||
|---|---|---|---|---|---|---|---|---|---|---|
| 2015 | 2016 | 2017 | 2015 | 2016 | 2017 | 2015 to 2016 | 2016 to 2017 | |||
| Coastal | 7,104 | 7,289 | 7,589 | 4.3% (3.8%–4.7%) | 7.0% (6.4%–7.6%) | 11.6% (10.8%–12.4%)* | 64.9% | 65.6% | ||
| Moor to Sea | 8,605 | 6,179 | 6,434 | 7.7% (7.1%–8.3%) | 12.0% (11.1%–12.8%) | 8.2% (7.5%–8.9%) | 55.2% | –31.3% | ||
| Newton Abbot | 8,265 | 11,170 | 11,697 | 6.5% (5.9%–7.0%) | 8.5% (8.0%–9.0%) | 10.3% (9.7%–10.8%) | 30.8% | 20.7% | ||
| Paignton and Brixham | 14,010 | 14,329 | 14,976 | 6.7% (6.3%–7.2%) | 6.6% (6.2%–7.0%) | 6.6% (6.2%–7.0%) | –2.2% | 0.7% | ||
| Torquay | 10,963 | 11,110 | 11,510 | 6.3% (5.8%–6.8%) | 8.1% (7.6%–8.7%) | 7.8% (7.3%–8.3%) | 29.4% | –3.9% | ||
| Total (not incl. Coastal) | 41,843 | 42,788 | 44,617 | 6.8% (6.5%–7.0%) | 8.3% (8.0%–8.5%) | 8.1% (7.9%–8.4%) | 22.0% | –1.8% | ||
| Total | 48,947 | 50,077 | 52,206 | 6.4% (6.2%–6.6%) | 8.1% (7.8%–8.3%) | 8.6% (8.4%–8.9%) | 26.2% | 6.7% | ||
[i] Key: EIC = Enhanced Intermediate Care; * = statistically significant (p ≤ 0.05), compared to other localities and Total (not incl. Coastal) within year.
Note: Moor to Sea referrals were recorded differently after 2016 bringing it into line with other areas, possibly explaining the fall in cases. The locality boundary also changed but this was adjusted for.
Table 4
Yearly mean of average monthly length of episode (LOE) (days) for intermediate care, patients placed in IC beds and home-placed patients for 2016 and 2017.
| EIC CASES – AV. MONTHLY LOE (DAYS) (95% CI) | % EIC CASES PLACED (95% CI) | IC PLACEMENTS – AV. MONTHLY LOE (DAYS) (95% CI) | IC HOME-BASED CARE – AV. MONTHLY LOE (DAYS) (95% CI) | ||||||||
|---|---|---|---|---|---|---|---|---|---|---|---|
| LOCALITY | 2016 | 2017 | 2016 | 2017 | 2016 | 2017 | 2016 | 2017 | |||
| Coastal | 7.9 (6.8–8.9)* | 9.0 (7.6–10.4)* | 9.4% (5.6%–13.2%) | 8.7% (7.2%–10.2%) | 19.1 (15.2–23.0) | 22.2 (17.5–26.9) | 6.6 (5.9–7.3)* | 7.8 (6.5–9.2)* | |||
| Moor to Sea | 13.0 (11.6–14.4) | 15.1 (14.0–16.1) | 9.5% (5.5%–13.6%) | 20.1% (16.3%–23.9%) | 26.9 (20.3–33.4) | 27.1 (23.1–31.1) | 11.5 (10.5–12.6) | 12.2 (10.6–13.9) | |||
| Newton Abbot | 42.3 (31.7–52.9) | 20.1 (17.7–22.5) | 5.5% (3.9%–7.1%) | 9.1% (6.0%–12.2%) | 63.7 (53.7–73.8) | 33.8 (21.3–46.2) | 40.9 (29.7–52.1) | 18.5 (16.8–20.2) | |||
| Paignton and Brixham | 41.2 (36.9–45.5) | 33.6 (28.3–38.9) | 29.3% (23.9%–34.7%) | 40.5% (33.8%–47.2%) | 37.3 (29.6–45.0) | 29.3 (24.5–34.0) | 41.4 (35.9–46.8) | 36.0 (28.6–43.4) | |||
| Torquay | 21.7 (19.6–23.8) | 20.8 (18.9–22.6) | 41.0% (35.6%–46.3%) | 47.3% (42.7%–52.0%) | 24.9 (22.0–27.8) | 25.0 (22.2–27.8) | 18.7 (15.6–21.9) | 15.7 (12.4–19.0) | |||
| Total | 27.9 (24.9–30.9) | 20.4 (18.9–21.8) | 19.9% (17.2%–22.6%) | 25.0% (23.1%–26.9%) | 32.2 (28.5–35.9) | 27.2 (24.2–30.2) | 26.5 (22.5–30.6) | 17.8 (16.1–19.6) | |||
[i] Key: EIC = Enhanced Intermediate Care; IC = Intermediate Care; LOE = Length of episode; Av. = average; * = statistically significant (p ≤ 0.05), compared to other localities within year.
Table 5
Intermediate care home referral rates, GP referral rates to EIC and to Emergency Department (ED) for ≥70 year-olds and referral rate ratios between GP and ED for 2015 and 2017 by locality.
| LOCALITY | HOME-BASE CARE REFERRAL RATES (95% CI) | GP REFERRAL RATES TO EIC (95% CI) | GP REFERRALS RATES TO ED (95% CI) | GP: ED REFERRAL RATE RATIO | ||||||||
|---|---|---|---|---|---|---|---|---|---|---|---|---|
| 2015 | 2016 | 2017 | 2016 | 2017 | 2016 | 2017 | 2016 | 2017 | ||||
| Coastal | 3.6% (3.1%–4.0%) | 6.3% (5.7%–6.9%) | 10.5%* (9.8%–11.2%) | 1.5% (1.2%–1.8%) | 2.9%* (2.5%–3.3%) | 2.9%* (2.5%–3.3%) | 3.1% (2.7%–3.5%) | 0.51 | 0.93β | |||
| Moor to Sea | 6.9% (6.3%–7.4%) | 10.8% (10.0%–11.6%) | 6.5% (5.9%–7.1%) | 2.1% (1.7%–2.4%) | 1.9% (1.5%–2.2%) | 4.2% (3.7%–4.7%) | 3.7% (3.3%–4.2%) | 0.49 | 0.50 | |||
| Newton Abbotα | 6.1% (5.5%–6.6%) | 7.9% (7.4%–8.5%) | 9.1% (8.5%–9.6%) | 2.3% (2.0%–2.5%) | 2.0% (1.7%–2.2%) | 5.6% (5.1%–6.0%) | 5.1% (4.7%–5.5%) | 0.41 | 0.38 | |||
| Paignton and Brixham | 5.0% (4.6%–5.3%) | 4.3% (3.9%–4.6%) | 3.5% (3.2%–3.8%) | 2.2% (1.9%–2.4%) | 1.7% (1.5%–1.9%) | 5.0% (4.7%–5.4%) | 4.6% (4.3%–5.0%) | 0.43 | 0.37 | |||
| Torquay | 3.7% (3.3%–4.0%) | 4.4% (4.0%–4.8%) | 3.7% (3.4%–4.1%) | 1.9% (1.6%–2.1%) | 1.5% (1.3%–1.7%) | 6.5% (6.0%–6.9%) | 6.7% (6.2%–7.2%) | 0.29 | 0.22 | |||
| Total (not Coastal) | 5.2% (5.0%–5.4%) | 6.2% (6.0%–6.4%) | 5.4% (5.2%–5.7%) | 2.1% (2.0%–2.2%) | 1.7% (1.6%–1.9%) | 5.4% (5.2%–5.6%) | 5.2% (4.9%–5.4%) | 0.39 | 0.34 | |||
| Total | 5.0% (4.8%–5.2%) | 6.2% (6.0%–6.4%) | 6.1% (5.9%–6.4%) | 2.0% (1.9%–2.1%) | 1.9% (1.8%–2.0%) | 5.1% (4.9%–5.3%) | 4.9% (4.7%–5.0%) | 0.40 | 0.39 | |||
[i] Key: EIC = Enhanced Intermediate Care; GP = General practice; ED = Emergency department; GP: ED referral rate ratio = the rate of GP referrals to EIC divided by the rate of GP referrals direct to ED; * = statistically significant (p ≤ 0.05) compared to other localities and Total (not incl. Coastal) within year, using continuity correction.
Note: α Included part of Moor to Sea in 2016, although this was adjusted for.
β A high relative ratio persisted in 2018 with ratios in other localities remaining similar.
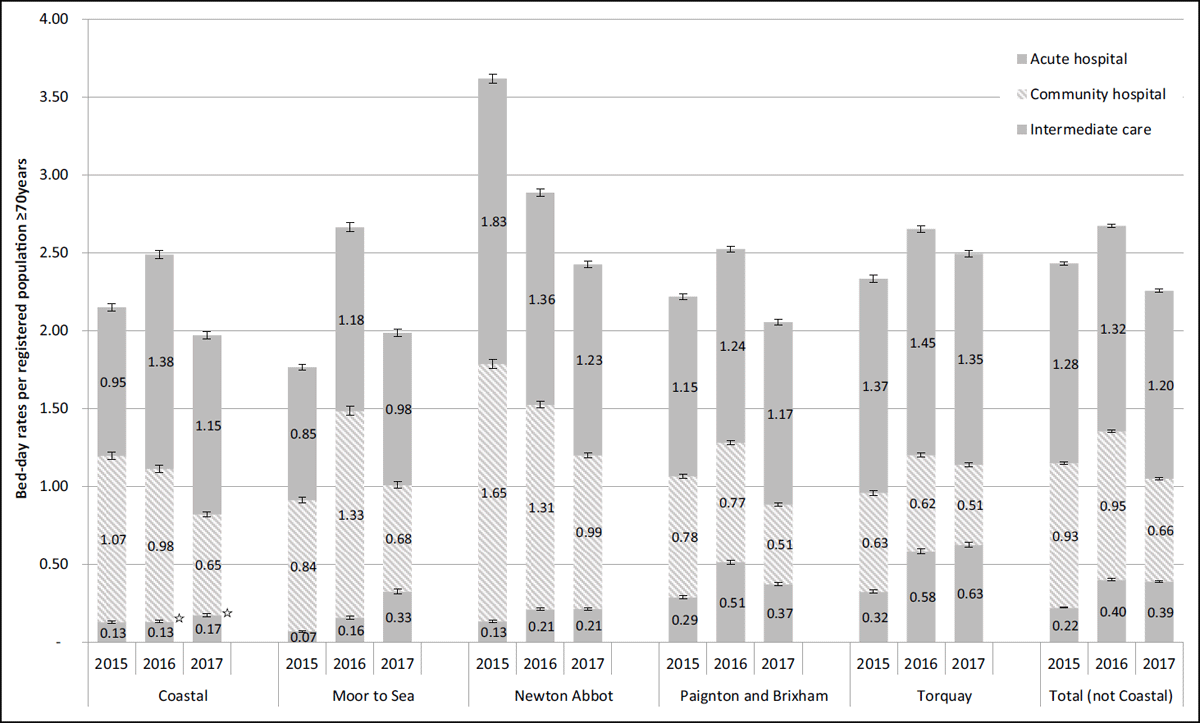
Figure 3
Trends in bed-day rates for intermediate care beds, community and acute hospital beds for ≥70 year-olds by locality between 2015 and 2017.
Key: ☆ = p ≥ 0.05 compared to other localities within year.
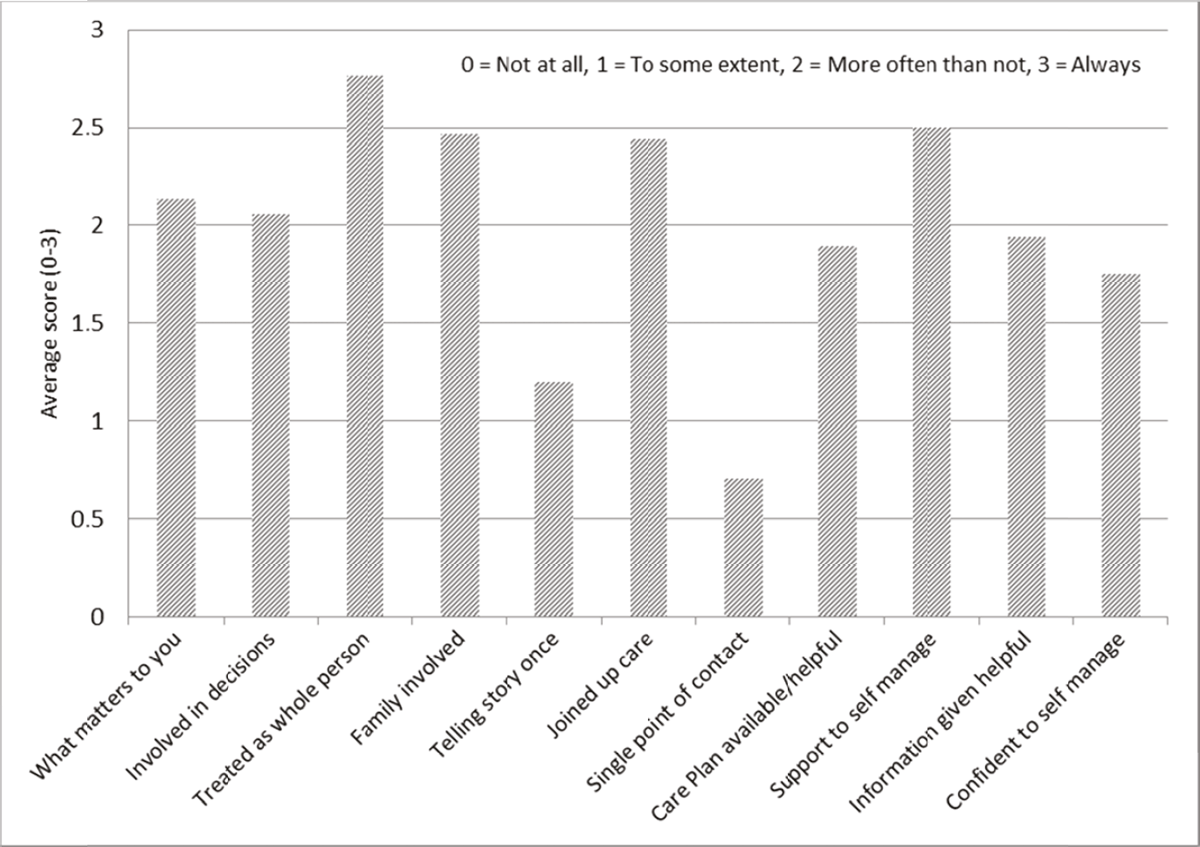
Figure 4
Patient experience questionnaire (P3C-EQ, N = 17), Coastal locality.
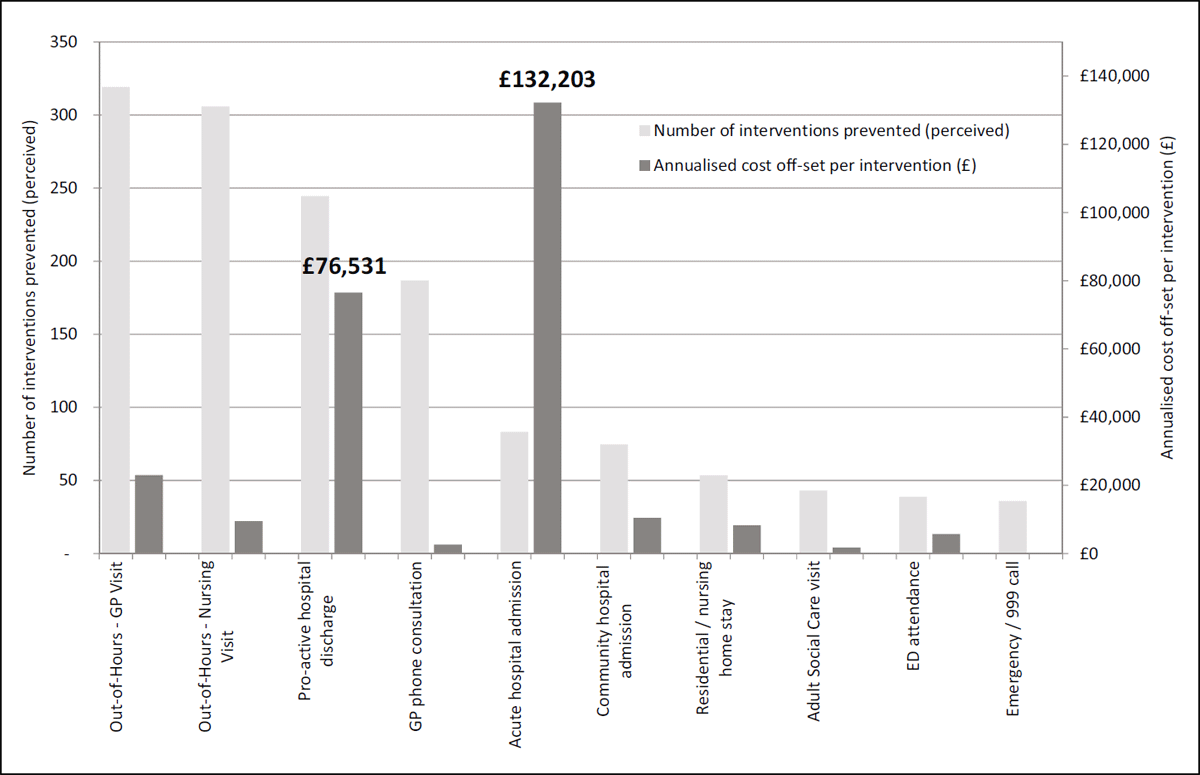
Figure 5
Perceived prevented impact of enhanced intermediate care and associated costs (annualised) in Coastal locality.