
Table 1
Evaluated implementation of integrated care for patients with diabetes and/or hypertension in Slovenia and separately for urban and rural regions.
| ICP GRID ELEMENT | SLOVENIA | RURAL REGION MEAN (MIN, MAX) | URBAN REGION MEAN (MIN, MAX) |
|---|---|---|---|
| E1 – Identification | 4.9 | 4.9 (4.8, 5.0) | 5.0 (5.0, 5.0) |
| E2 – Treatment | 4.0 | 4.0 (3.8, 4.1) | 4.0 (3.7, 4.1) |
| E3 – Health Education | 4.2 | 4.1 (4.0, 4.3) | 4.2 (3.5, 5.0) |
| E4 – Self-management Support | 2.6 | 2.9 (2.7, 3.1) | 2.3 (2.2, 2.5) |
| E5 – Structured collaboration | 3.1 | 3.1 (2.6, 3.6) | 3.0 (2.4, 3.4) |
| E6 – Care organization | 3.6 | 3.6 (3.2, 4.0) | 3.7 (2.8, 4.2) |
| Overall | 3.7 | 3.8 (3.7, 3.8) | 3.7 (3.6, 3.9) |
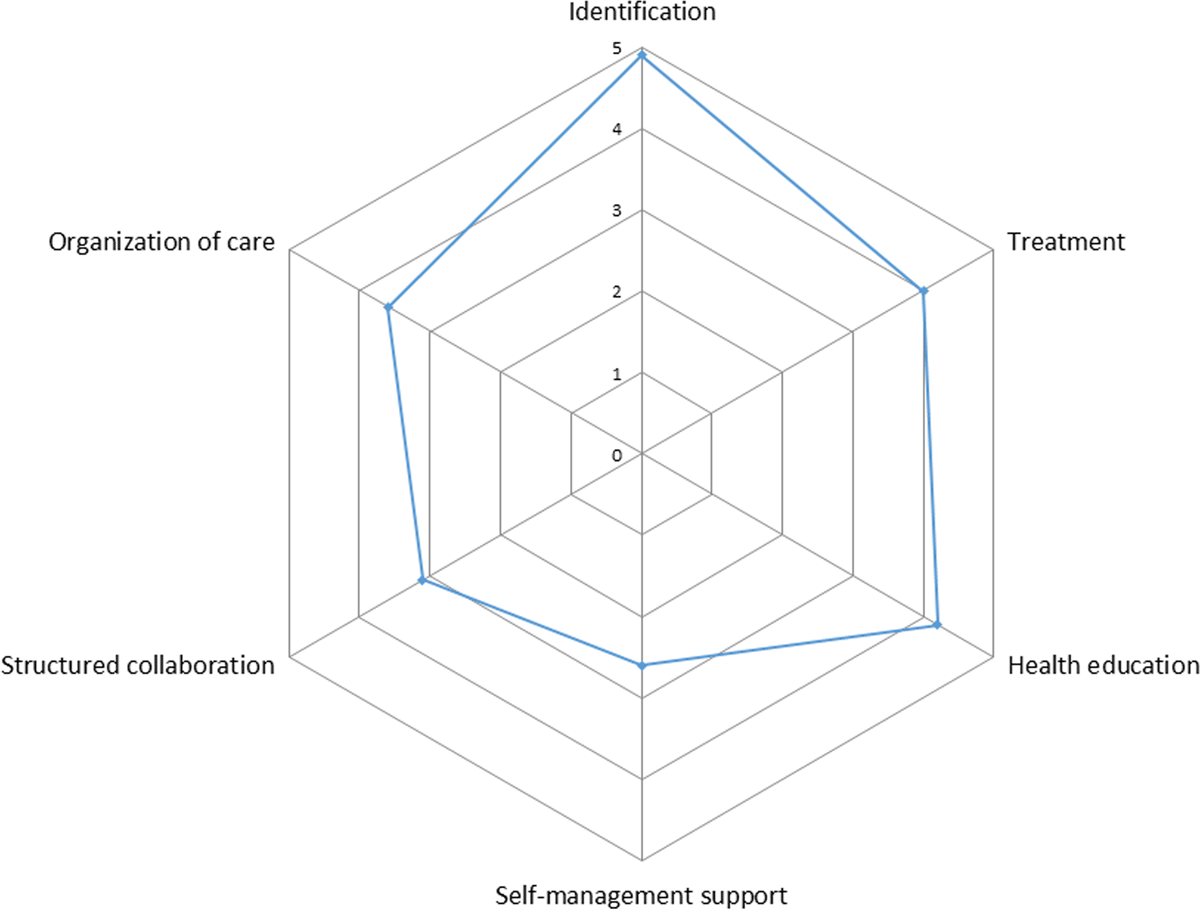
Figure 1
Graphic presentation of the ICP Grid scores for Slovenia.
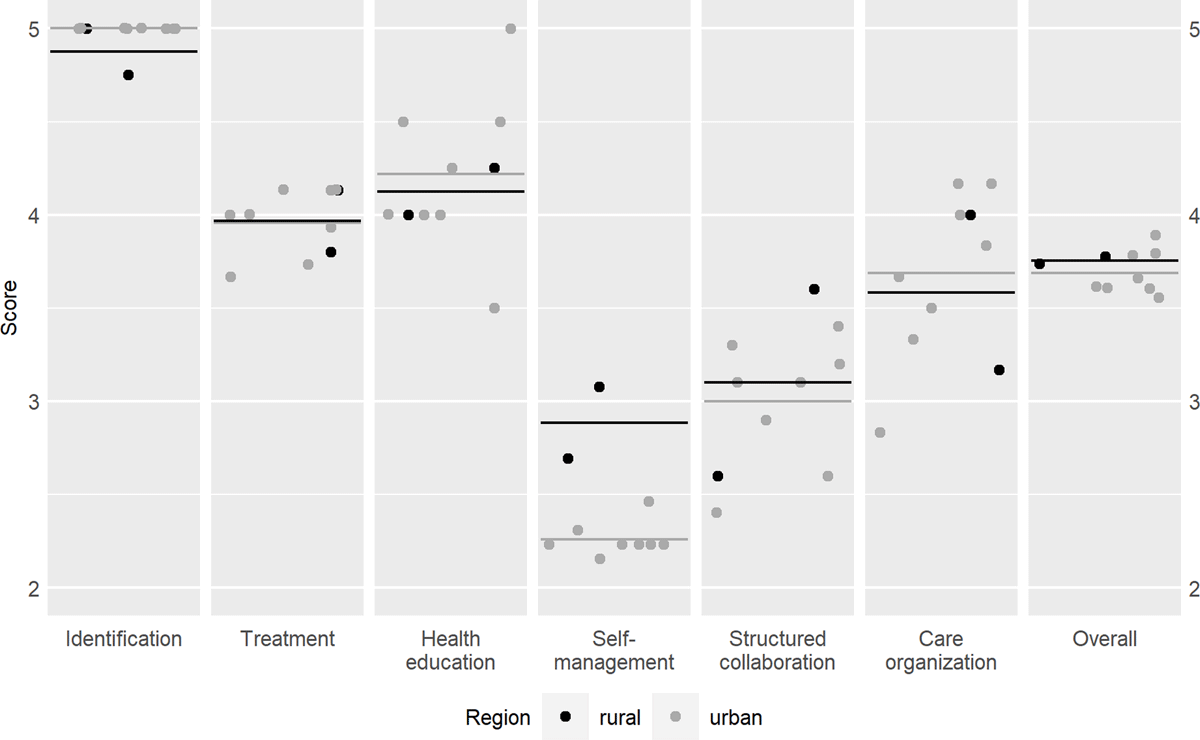
Figure 2
Graphical presentation of the ICP Grid scores for individual health care organisation and for regions in Slovenia.