
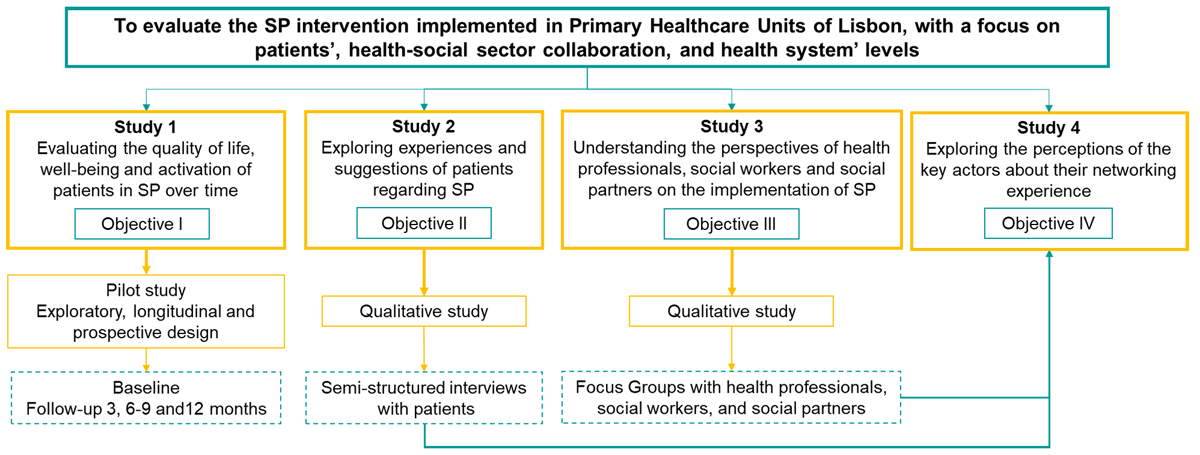
Figure 1
Description of the studies and objectives.
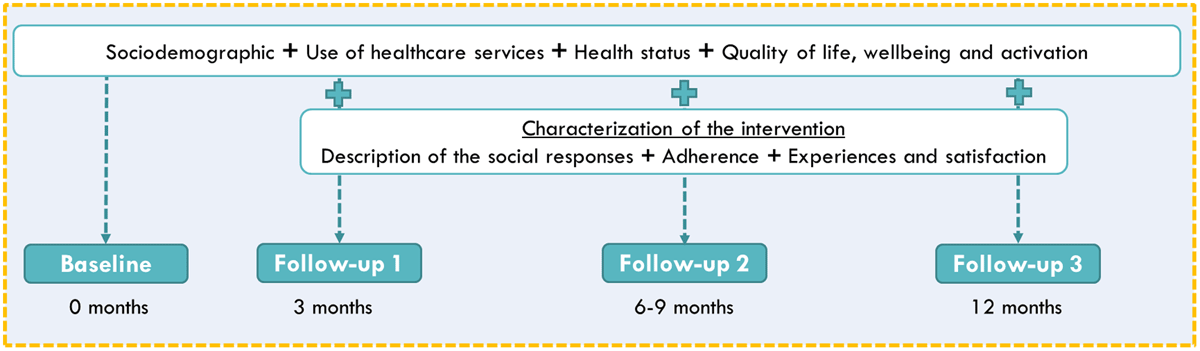
Figure 2
Moments of assessment.
Table 1
Summary table of the evaluation’s quantitative component.
| EVALUATION MOMENT | INFORMATION SOURCES | INSTRUMENTS | GROUPS OF VARIABLES | VARIABLES |
|---|---|---|---|---|
| Baseline, follow-up 1, 2 and 3 | Patient | Questionnaire | Sociodemographic characteristics | – Sex – Age – Country of birth – Educational level – Employment status – Number of people in the household – Average monthly income of the household – Preferred Language |
| Health status | – Weight and height – Physical activity – Smoking status – Alcohol consumption | |||
| Well-being | – WEMWBS | |||
| Patient’s activation | – PAM13 | |||
| Quality of life | – EQ-5D-3L | |||
| Computer system | Health units’ Databases | Health status | – Number of chronic diseases – Types of chronic diseases – Medications consumption | |
| Use of healthcare services | – Number of appointments in the Primary Healthcare Services – Number of hospital admissions – Number of emergency episodes | |||
| Follow-up 1, 2 and 3 | Health professionals, social workers and community partners | Forms | Characterization of the intervention | – Type of health professional that made the referral – Motive for referral – Activities provided – Accepted and planned activities – Adherence to the activities |