
Table 1
Patient Demographic Information (n = 1,925).
| DEMOGRAPHIC CHARACTERISTIC | N (%) |
|---|---|
| Gender | |
| Male | 1,155 (60%) |
| Female | 770 (40%) |
| Treatment Modality/Setting | |
| Multi-Care Kidney Clinic (MCKC) | 1,001 (52%) |
| In-Center Dialysis | 616 (32%) |
| Home Dialysis | 308 (16%) |
| Geographic Location of Treatment Facility | |
| Large Urban Population Center | 1,367 (71%) |
| Medium Population Center | 404 (21%) |
| Small Population Center | 106 (5.5%) |
| Rural Area | 48 (2.5%) |
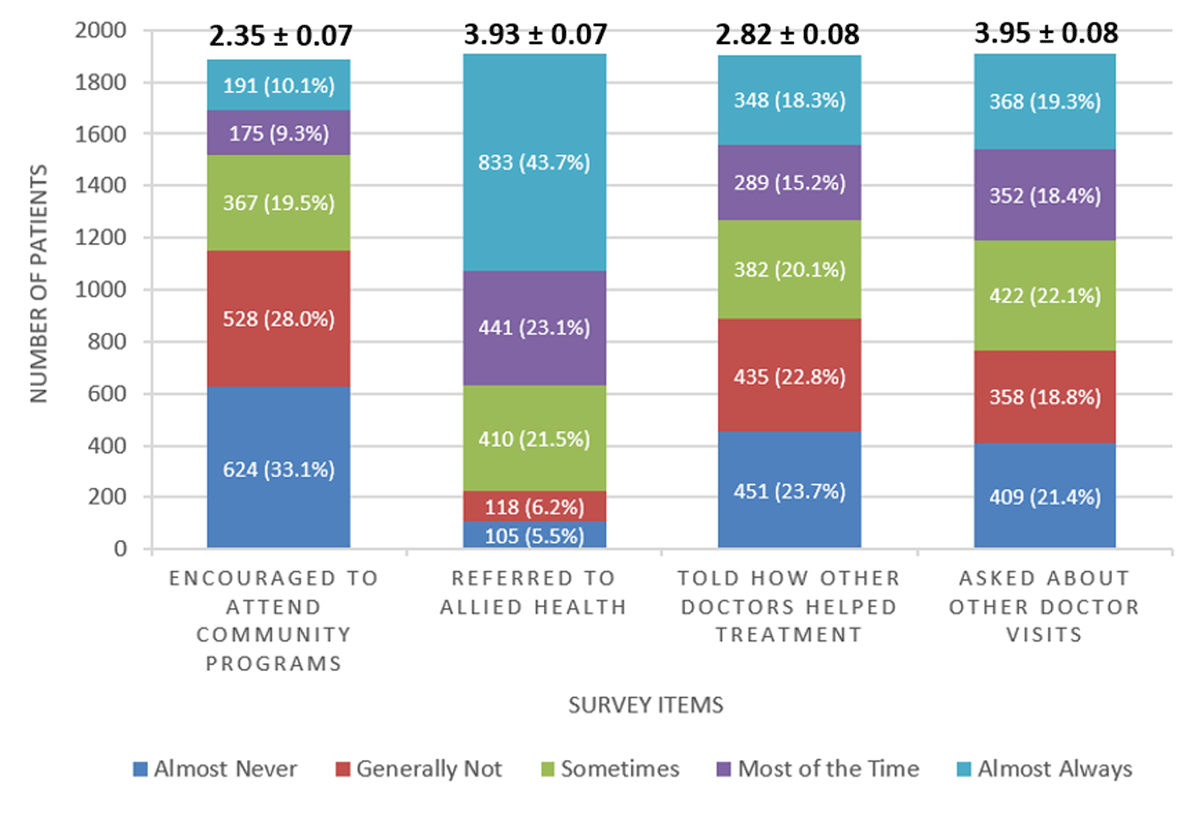
Figure 1
Summary of Patient Survey Responses (n = 1,925). Each stacked bar depicts the number and percentage of respondents per response option per survey item. Above each bar are the mean and standard error of the mean for that survey item.
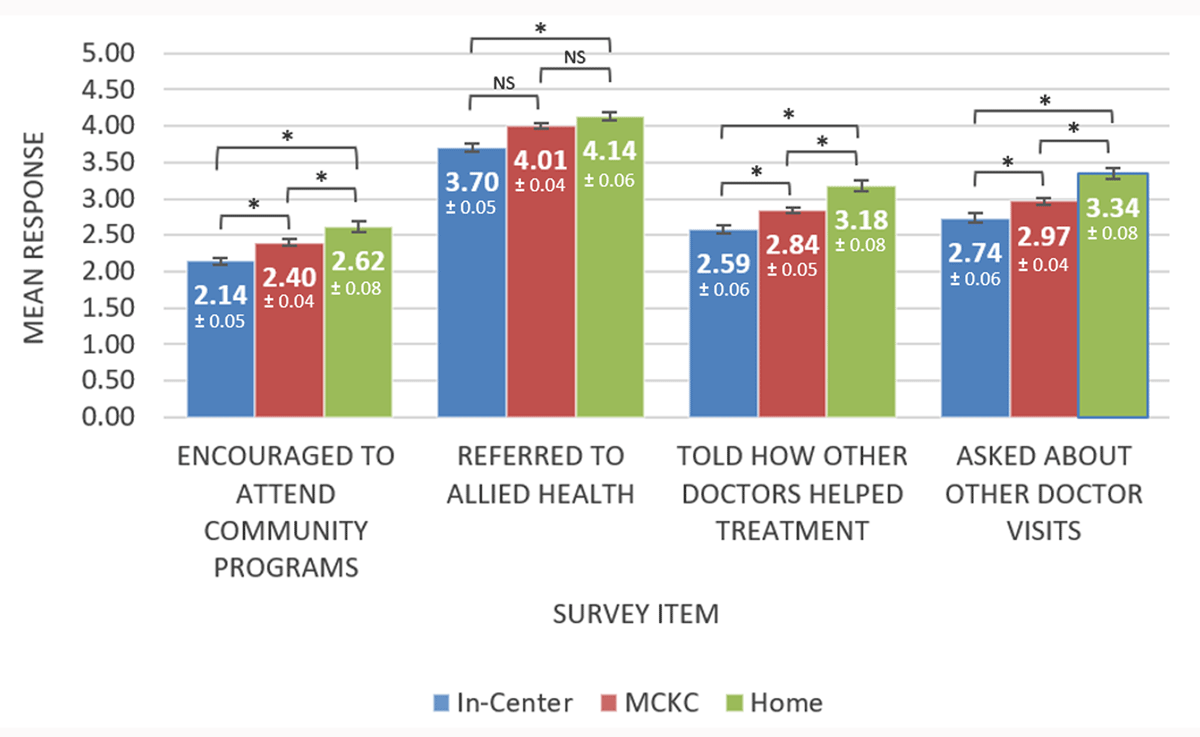
Figure 2
Patient Survey Responses by Treatment Modality/Setting (n = 1,925). Each group of bars depict the mean response per survey item for each of the three treatment modality groups. At the top of each bar are the mean and standard error of the mean (also depicted as an error bar) for each survey item by modality group. A higher mean indicates higher perceived coordination of care. The square brackets indicate that tests of significance were conducted between pairs of groups (i.e., In-Center and Multi-Care Kidney Clinic (MCKC), MCKC and Home, and In-Center and Home).
* Significant difference at p < 0.001.
NS Not Significant.
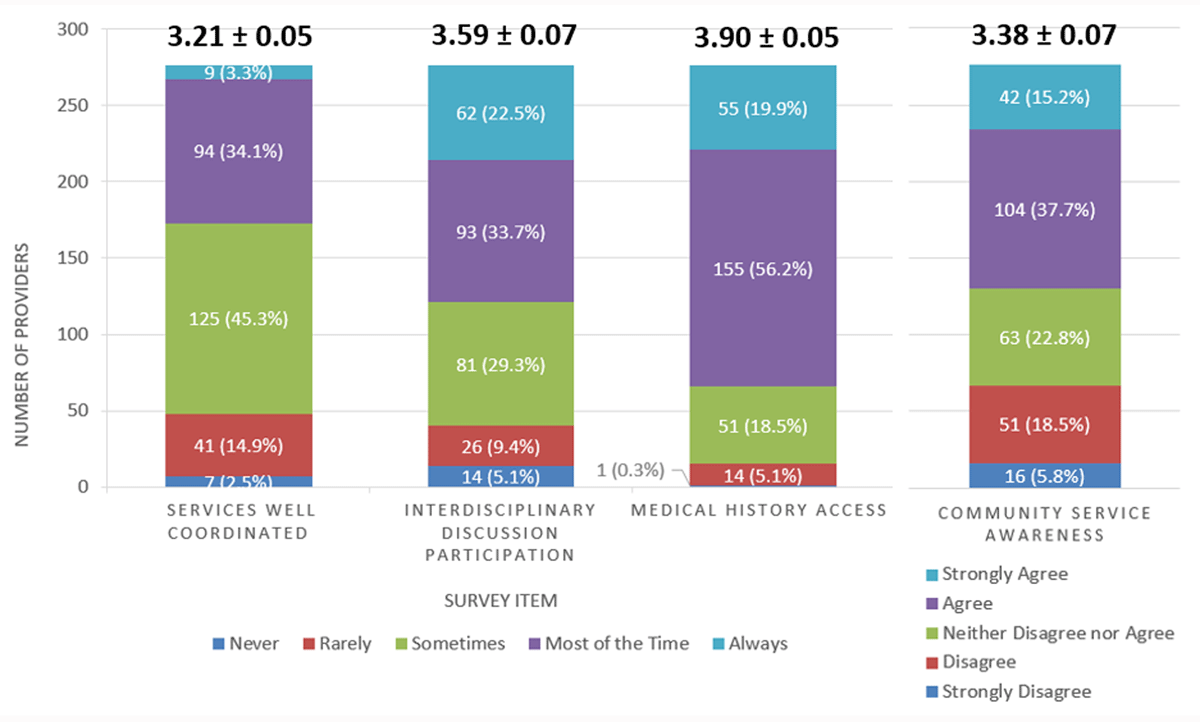
Figure 3
Summary of Provider Survey Responses (n = 276). Each stacked bar depicts the number and percentage of respondents per response option per survey item. Above each bar are the mean and standard error of the mean for each survey item.
Table 2
Healthcare Professional Demographic Information (n = 276).
| DEMOGRAPHIC CHARACTERISTIC | N (%) |
|---|---|
| Professional Role | |
| Nurse* | 60 (21.7%) |
| Home dialysis nurse | 56 (20.3%) |
| Nephrologist | 53 (19.2%) |
| Social worker | 50 (18.1%) |
| Administration | 39 (14.1%) |
| Nurse practitioner | 18 (6.5%) |
| Years in Practice | |
| 5 years or less | 58 (21.0%) |
| 6–10 years | 37 (13.4%) |
| 11–20 years | 103 (37.3%) |
| 21 years or more | 78 (28.3%) |
| Age | |
| 25–34 years old | 15 (5.4%) |
| 35–44 years old | 63 (22.8%) |
| 45–54 years old | 115 (41.7%) |
| 55–64 years old | 80 (29%) |
| 65 years and older | (1.1%) |
[i] * This category includes both MCKC nurses and in-center hemodialysis nurses. Due to the wording in the survey, we were unable to distinguish between these two groups.