
Table 1
Full search strategy for PubMed.
| DATABASE | PUBMED |
|---|---|
| Time coverage | From January 1, 2010 to June 30, 2018 |
| Date of search | August 20, 2018 |
| Limits | In: “Article Title, Abstract, Keywords” Date range: All years |
| Search query | ((integrat* care) OR (integrat* healthcare) OR (integrat* health care) OR (integrat* health service) OR (integrat* health delivery)) AND ((Singapore) OR (China) OR (Philippines) OR (India) OR (Vietnam) OR (Fiji)) |
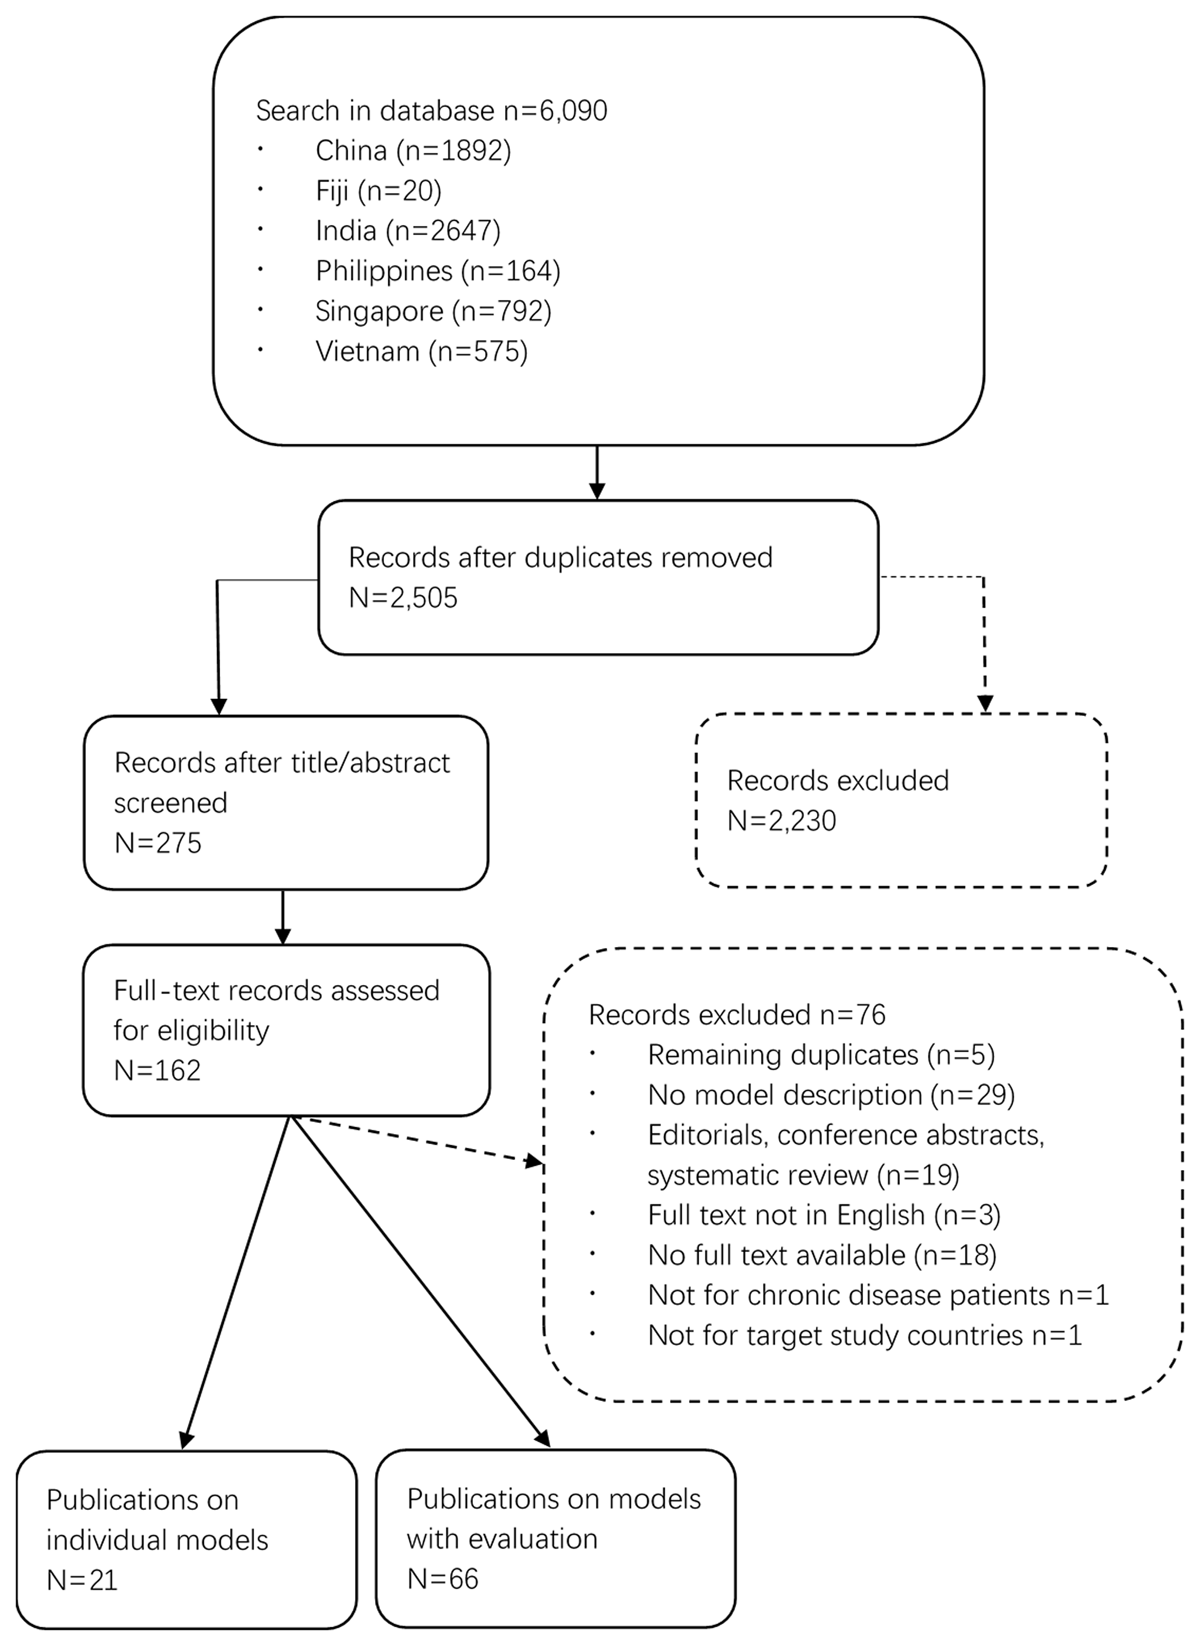
Figure 1
Flow chart of literature search.
Table 2
Basic characteristics of integrated care programmes.
| PROGRAMME CHARACTERISTIC | TOTAL (=87) | COUNTRY (N=) | ||||||
|---|---|---|---|---|---|---|---|---|
| CHINA (=44) | INDIA (=12) | SINGAPORE (=21) | FIJI (=1) | VIETNAM (=5) | PHILIPPINES (=4) | |||
| Scope of Implementation | National | 21 | 2 | 12 | 5 | 1 | 1 | / |
| Regional | 63 | 41 | / | 14 | / | 4 | 4 | |
| Unknown | 3 | 1 | / | 2 | / | / | / | |
| Breadth of Integration | Horizontal | 13 | 6 | 2 | 1 | / | 3 | 1 |
| Vertical | 31 | 20 | 1 | 6 | / | 1 | 3 | |
| Both | 23 | 5 | 9 | 7 | 1 | 1 | / | |
| Unknown | 20 | 13 | / | 7 | / | / | / | |
| Degree of Integration | Full | 6 | / | 3 | 1 | / | / | 2 |
| Coordination | 29 | 16 | 2 | 9 | / | 1 | 1 | |
| Linkage | 22 | 13 | 3 | 2 | / | 3 | 1 | |
| Coordination & Linkage | 6 | / | 4 | 1 | / | 1 | / | |
| Unknown | 24 | 15 | / | 8 | 1 | / | / | |
| Programme Attribute | Public | 62 | 36 | 2 | 15 | 1 | 5 | 3 |
| Private | 3 | 2 | 1 | / | / | / | / | |
| Public & Private | 19 | 5 | 9 | 4 | / | / | 1 | |
| Unknown | 3 | 1 | / | 2 | / | / | / | |
| Target Condition | General NCDs | 25 | 14 | 2 | 8 | 1 | / | / |
| Individual Diseases | 52 | 26 | 5 | 12 | / | 5 | 4 | |
| Multiple Diseases | 10 | 4 | 5 | 1 | / | / | / | |
Table 3
Number of integrated care programmes by country and disease.
| DISEASE | COUNTRY (N=) | |||||
|---|---|---|---|---|---|---|
| CHINA (=44) | INDIA (=12) | SINGAPORE (=21) | FIJI (=1) | VIETNAM (=5) | PHILIPPINES (=4) | |
| General NCD Population | 14 | 2 | 8 | 1 | / | / |
| Diabetes | 5 | / | 3 | / | / | 2 |
| Tuberculosis | 3 | / | / | / | / | 1 |
| Hip Fractures | / | / | 3 | / | / | / |
| COPD | 3 | / | 2 | / | / | / |
| Hypertension | 3 | / | / | / | / | / |
| Cancer | 2 | 2 | / | / | / | / |
| Dementia | / | / | 2 | / | / | / |
| HIV | 4 | 1 | / | / | 4 | / |
| STD | 1 | / | / | / | / | / |
| End-stage renal failure | 1 | / | / | / | / | / |
| Pre-term infants | 1 | / | / | / | / | / |
| CVD | 1 | / | / | / | / | / |
| Mental-health disorders | 2 | 1 | / | / | 1 | 1 |
| Coronary health disease | / | 1 | / | / | / | / |
| Cardio-metabolic syndrome | 1 | / | / | / | / | / |
| Rheumatic diseases | / | / | 1 | / | / | / |
| Osteoporosis | / | / | 1 | / | / | / |
| Palliative Care | / | / | 1 | / | / | / |
| Multiple above conditions | 4 | 5 | / | / | / | / |
Table 4
Summary of the elements of integrated care found in the models identified from the literature.
| DIMENSIONS OF INTEGRATION | ELEMENTS OF INTEGRATION | TOTAL (=87) | COUNTRY (N=) | |||||
|---|---|---|---|---|---|---|---|---|
| CHINA (=44) | INDIA (=12) | SINGAPORE (=21) | FIJI (=1) | VIETNAM (=5) | PHILIPPINES (=4) | |||
| Delivery System Design | Multidisciplinary team | 63 | 26 | 12 | 19 | / | 2 | 4 |
| Care coordinator/care manager | 43 | 18 | 5 | 14 | / | 3 | 3 | |
| Referral system | 30 | 16 | 2 | 8 | / | 1 | 3 | |
| Defined eligibility criteria | 33 | 11 | 8 | 9 | / | 2 | 3 | |
| Risk stratification of patients | 19 | 8 | 4 | 5 | / | / | 2 | |
| Single assessment | 11 | / | 3 | 6 | / | 2 | / | |
| Formulation of health plan | 35 | 14 | 6 | 12 | / | / | 3 | |
| Clinical Information System | Information sharing system | 33 | 20 | 5 | 6 | / | / | 2 |
| Use of telehealth | 28 | 15 | 2 | 9 | / | 1 | 1 | |
| Self-Management Support | Engaging users | 34 | 17 | 1 | 12 | / | 2 | 2 |
| Self-management support | 42 | 22 | 5 | 12 | / | / | 3 | |
| Support of informal carers | 17 | 5 | 5 | 3 | / | 2 | 2 | |
Table 5
The performance of the integrated care programmes measured by Donabedian’s framework for healthcare quality and chosen indicators.
| PERFORMANCE | INDICATORS | N= |
|---|---|---|
| Structure | Proportion of specialists to other doctors | 1 |
| Sharing of medical records | 1 | |
| Access to medical technology | 1 | |
| Process | Access to healthcare | 25 |
| Coordination of primary care with other care | 6 | |
| Hospital and A&E attendance | 3 | |
| Transferring between care providers and care delivery settings | 1 | |
| Personalized care planning | 1 | |
| Management of medications | 0 | |
| Outcome | Clinical outcomes | 26 |
| Patient and carer reported satisfaction | 19 | |
| Care utilization | 18 | |
| Quality of life | 17 | |
| Total cost of care | 12 | |
| Ability to self-manage condition | 6 | |
| Number of hospital readmissions | 6 | |
| Transitions in care delivery | 1 | |
| Number of adverse health events | 0 | |
| Ability to live independently | 0 |