
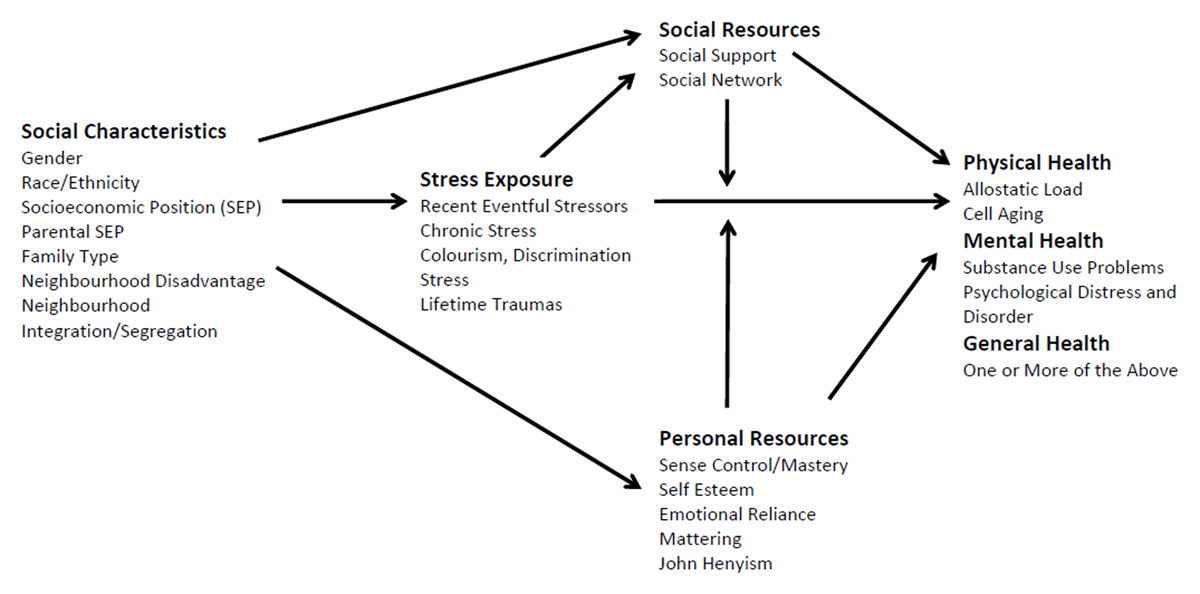
Figure 1
Stress Process Model [4].
Table 1
Key domains and linkages that can both cause and result from disadvantage [17].
| DOMAIN | KEY INFLUENCES ON DISADVANTAGE | COMMON INTERLINKAGES |
|---|---|---|
| Primary relationships | Childhood
Adulthood
|
|
| Education |
|
|
| Employment |
|
|
| Health and wellbeing |
|
|
| Identity |
|
|
| External environment |
|
|
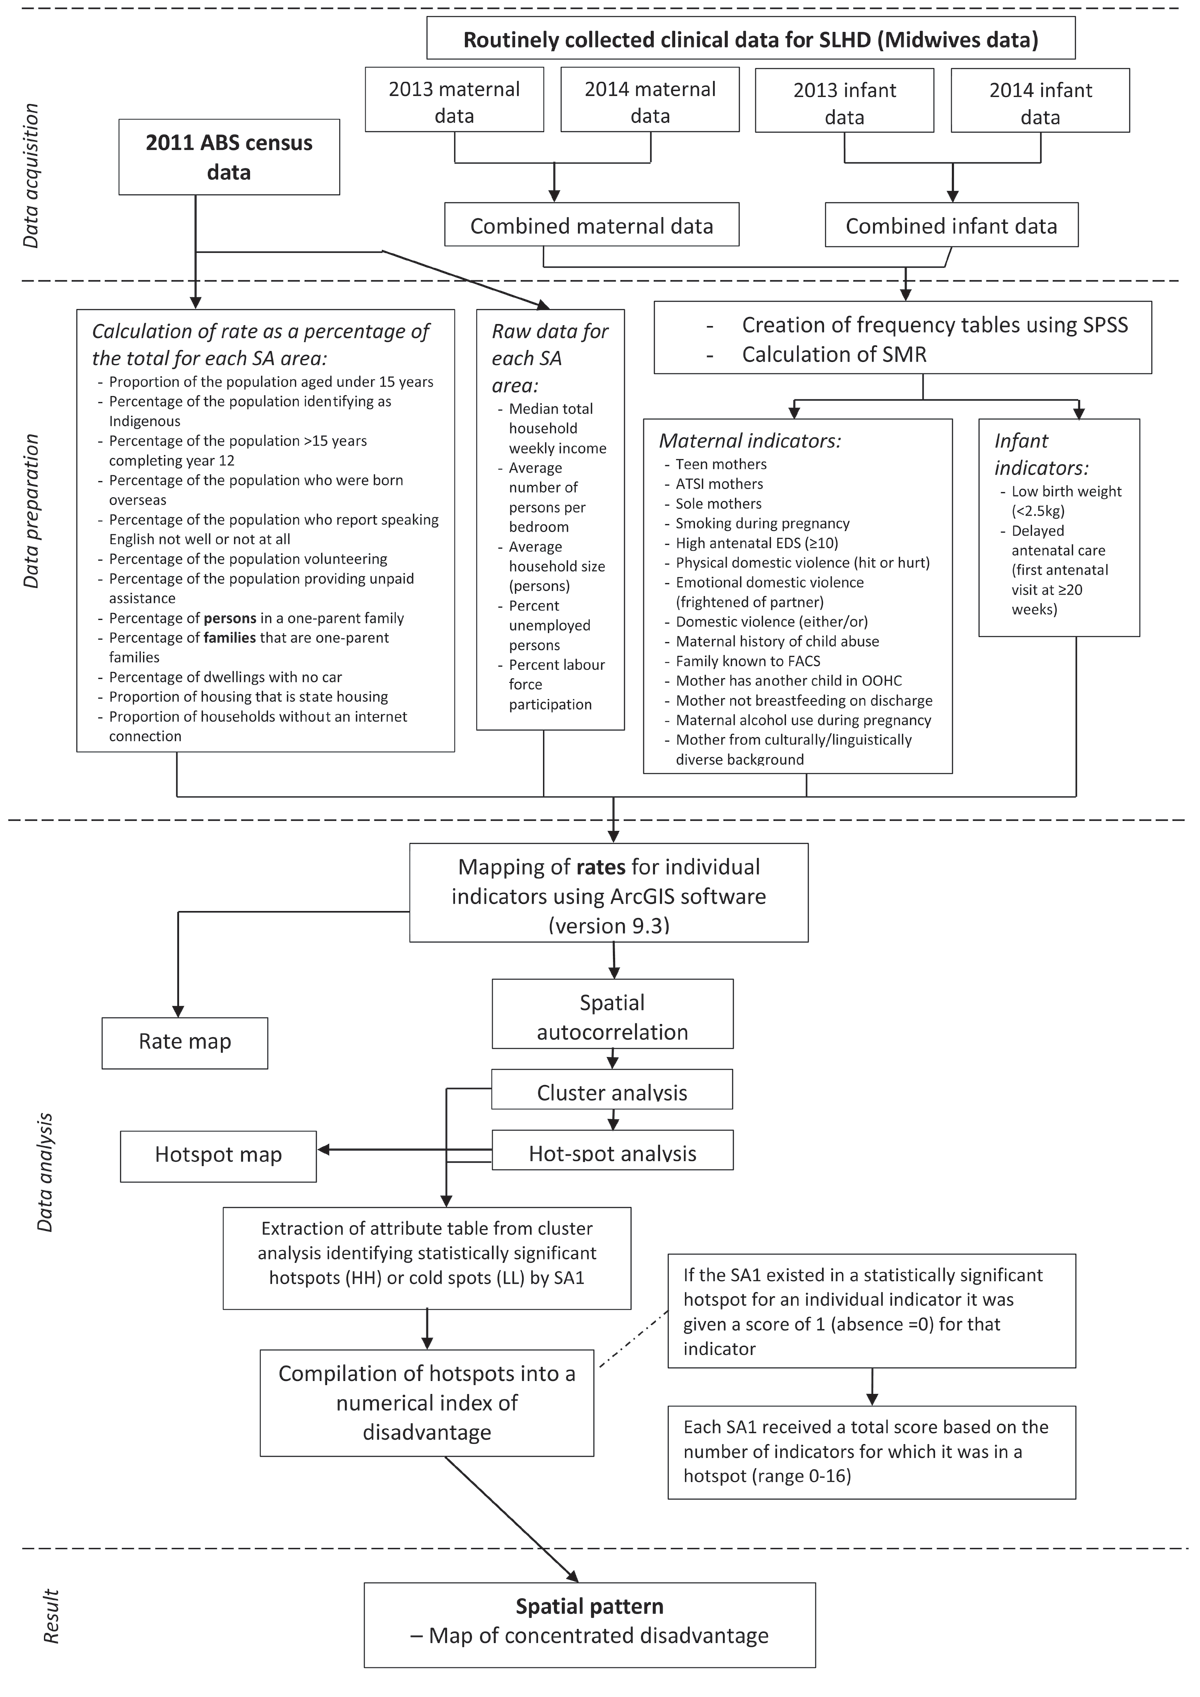
Figure 2
Overview of methods and analysis used.
Table 2
Demographic and Perinatal Indicators selected for study.
| DEMOGRAPHIC INDICATORS | PERINATAL INDICATORS |
|---|---|
|
|
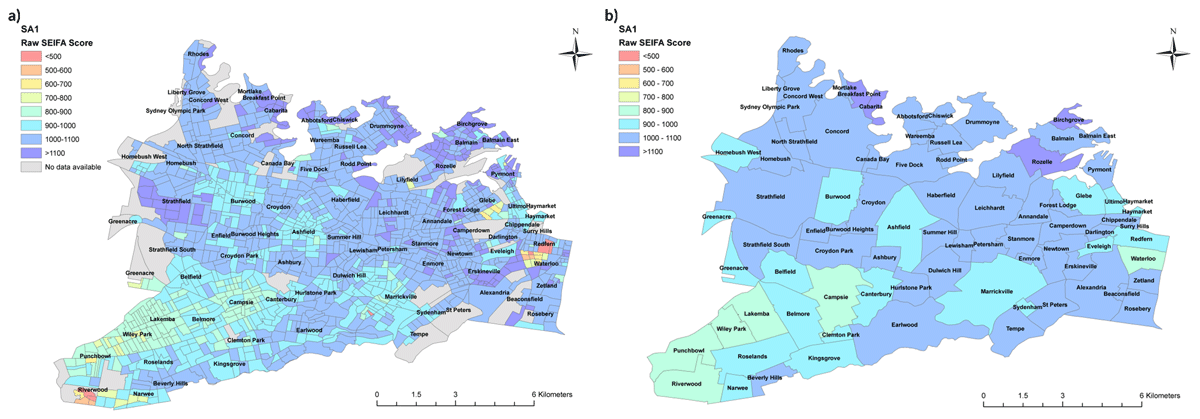
Figure 3
Comparison of SEIFA area if analysis done at a) SA1 level, b) Suburb level.
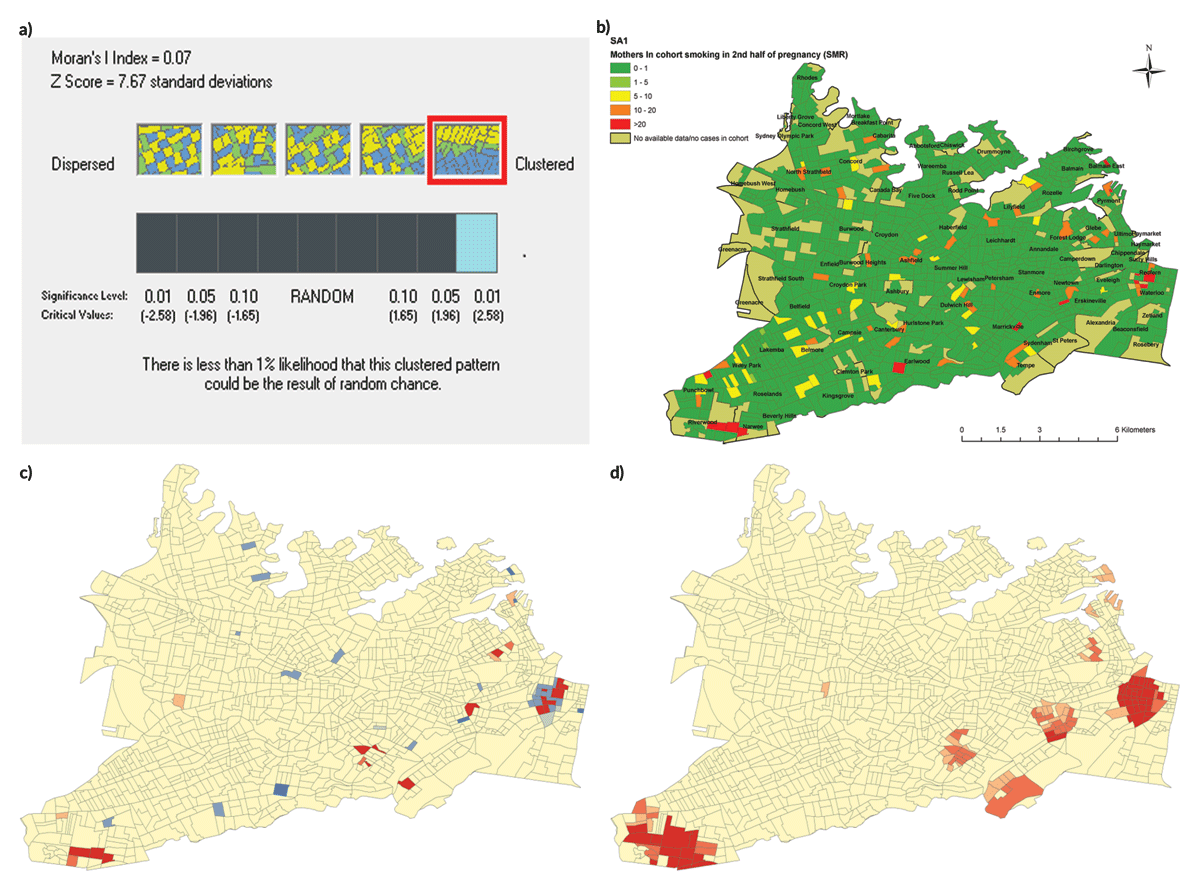
Figure 4
Spatial analysis in ArcGIS of “smoking”.
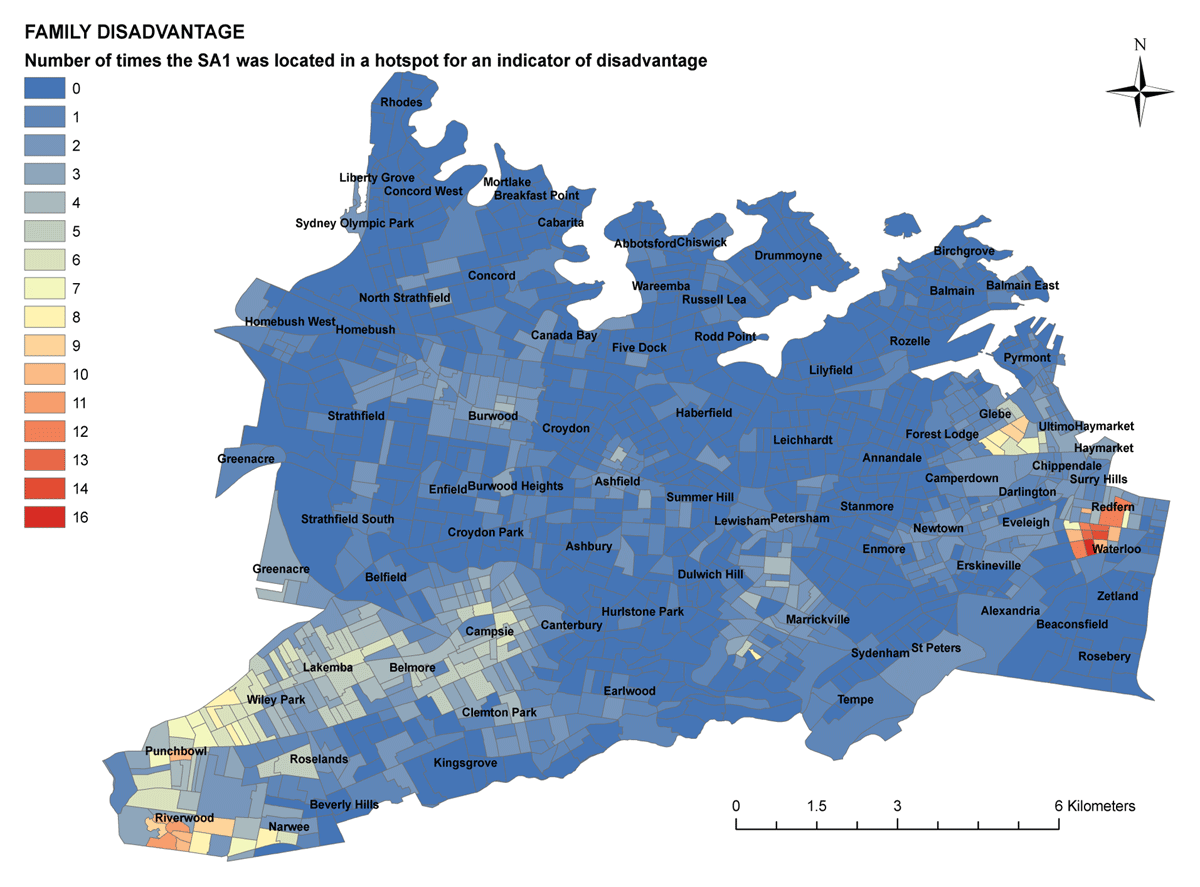
Figure 5
Final Hotspot Analysis of Disadvantage.