
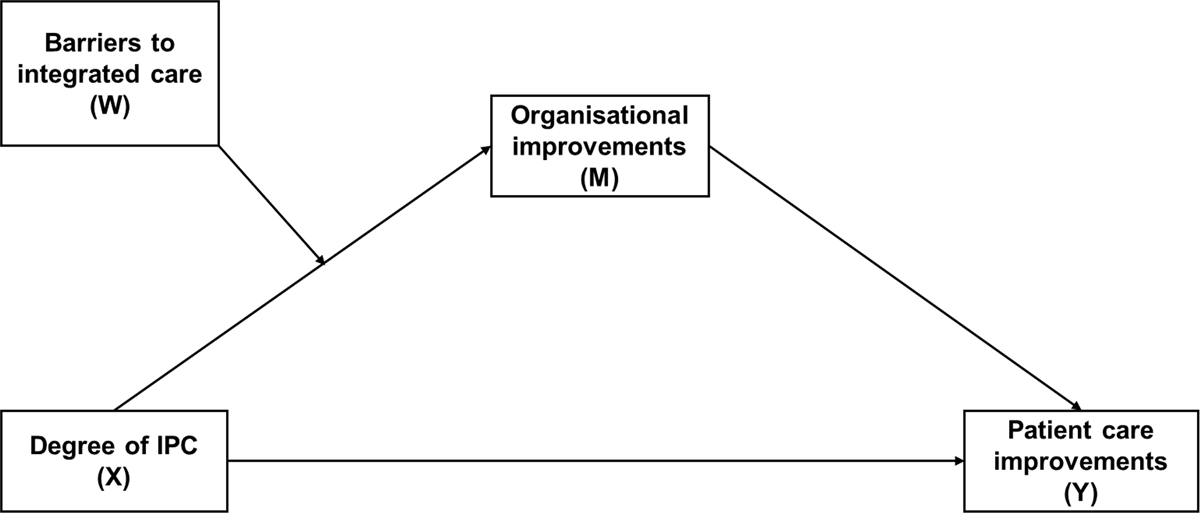
Figure 1
Hypothesized moderated mediation model. X is the predicting variable, Y is the outcome variable, M is the mediator, W is the moderator.
Table 1
Regression coefficients for the moderated mediation analysis, with financial barriers as moderator.
| Predictor | Outcome of 2-step regression analyses | ||||
|---|---|---|---|---|---|
| Step 1: Organisational improvements | Step 2: Patient care improvements | ||||
| B | (95%CI) | B | (95%CI) | ||
| Number of centred care services | 0.06 | (–0.10, 0.21) | 0.22 | (0.06, 0.38) | |
| Number of professionals involved | 0.29 | (–0.09, 0.15) | –0.21 | (–0.31, –0.11) | |
| IPC degree | 0.44 | (0.27, 0.60) | –0.07 | (–0.21, 0.07) | |
| Organisational improvements | – | – | 0.51 | (0.37, 0.66) | |
| Financial barriers | 0.33 | (0.16, 0.50) | – | – | |
| IPC degree * financial barriers | –0.25 | (–0.41, –0.10) | – | – | |
| R2 (%) | 21.9*** | 39.04*** | |||
| Conditional indirect effect of IPC implementation on Care improvements due to the initiative | |||||
| B | 95%CI | ||||
| –1 SD below the mean | 0.35 | (0.20, 0.53) | |||
| Mean | 0.22 | (0.13, 0.34) | |||
| +1 SD above the mean | 0.09 | (–0.01, 0.21) | |||
| Moderated mediation index (with Boot 95% CI) | –0.13 (–0.23, –0.04) | ||||
[i] Note: Scores are standardised; IPC degree * financial barriers = interaction between IPC degree and financial barriers.

Figure 2
Interaction of IPC degree and financial barriers on organisational improvements. Note: Low IPC = 1 SD below the mean; High IPC = +SD above the mean.