
Table 1
Descriptive statistics of patient characteristics before and after propensity score matching in different groups.
| Means – Lung cancer | Means – Stomach cancer | Means – Esophageal cancer | ||||||||||
|---|---|---|---|---|---|---|---|---|---|---|---|---|
| Treated n = 1,598 | unmatched Control n = 6,595 | matched Control n = 1,598 | percentage of improvement | Treated n = 1,008 | unmatched Control n = 4,685 | matched Control n = 1,008 | percentage of improvement | Treated n = 451 | unmatched Control n = 2,351 | matched Control n = 451 | percentage of improvement | |
| Gender: | ||||||||||||
| Female | 0.292 | 0.271 | 0.299 | 68.1 | 0.173 | 0.202 | 0.202 | –0.8 | 0.457 | 0.351 | 0.486 | 72.9 |
| Male | 0.708 | 0.729 | 0.701 | 68.1 | 0.827 | 0.798 | 0.798 | –0.8 | 0.543 | 0.650 | 0.514 | 72.9 |
| Age group: | ||||||||||||
| 18–44 | 0.021 | 0.026 | 0.027 | 17.0 | 0.050 | 0.035 | 0.046 | 72.5 | 0.007 | 0.008 | 0.004 | 130.0 |
| 45–54 | 0.187 | 0.100 | 0.109 | 10.4 | 0.125 | 0.106 | 0.115 | 48.1 | 0.106 | 0.074 | 0.084 | 31.6 |
| 55–64 | 0.290 | 0.275 | 0.304 | 9.9 | 0.286 | 0.273 | 0.267 | –48.2 | 0.328 | 0.288 | 0.277 | –28.2 |
| 65–74 | 0.348 | 0.331 | 0.338 | 41.4 | 0.369 | 0.361 | 0.387 | –114.6 | 0.344 | 0.349 | 0.368 | –340.9 |
| 75–84 | 0.135 | 0.230 | 0.188 | 43.5 | 0.152 | 0.202 | 0.157 | 90.1 | 0.195 | 0.244 | 0.237 | 14.1 |
| >85 | 0.019 | 0.039 | 0.034 | 23.3 | 0.019 | 0.024 | 0.029 | –114.3 | 0.020 | 0.037 | 0.029 | 46.7 |
| Status upon admission: | ||||||||||||
| Normal | 0.987 | 0.827 | 0.977 | 93.4 | 0.986 | 0.834 | 0.980 | 96.1 | 0.998 | 0.879 | 0.993 | 96.2 |
| Acute | 0.001 | 0.038 | 0.004 | 91.4 | 0.001 | 0.032 | 0.001 | 100.0 | 0.000 | 0.021 | 0.000 | 100.0 |
| urgent | 0.011 | 0.033 | 0.019 | 66.0 | 0.013 | 0.029 | 0.019 | 62.1 | 0.002 | 0.018 | 0.007 | 72.4 |
| other | 0.000 | 0.102 | 0.000 | 100.0 | 0.000 | 0.105 | 0.000 | 100.0 | 0.000 | 0.082 | 0.000 | 100.0 |
| surgery conducted or not | 0.033 | 0.448 | 0.031 | 99.5 | 0.142 | 0.494 | 0.204 | 82.2 | 0.087 | 0.522 | 0.129 | 90.3 |
| C3 index | 0.388 | 0.620 | 0.475 | 62.3 | 0.315 | 0.473 | 0.405 | 43.2 | 0.283 | 0.463 | 0.421 | 23.3 |
| No. of open beds | 427.4 | 474.0 | 338.6 | –91.0 | 407.9 | 429.6 | 357.5 | –131.7 | 413.4 | 457.7 | 354.8 | –32.1 |
| No. of regular budget physicians | 137.9 | 151.1 | 117.8 | –52.1 | 122.4 | 134.5 | 109.1 | –9.5 | 132.5 | 137.2 | 113.4 | –307.7 |
| No. of extra contracted physicians | 137.7 | 153.2 | 113.5 | –55.6 | 124.4 | 132.4 | 107.1 | –116.6 | 123.9 | 133.2 | 105.7 | –96.0 |
| No. of regular budget nurses | 38.3 | 58.8 | 26.1 | 40.7 | 35.7 | 51.9 | 29.8 | 62.8 | 36.3 | 55.6 | 27.4 | 54.2 |
| No. of extra contracted nurses | 154.2 | 141.2 | 110.5 | –234.4 | 146.1 | 128.0 | 127.6 | –2.2 | 150.9 | 135.3 | 120.0 | –97.8 |
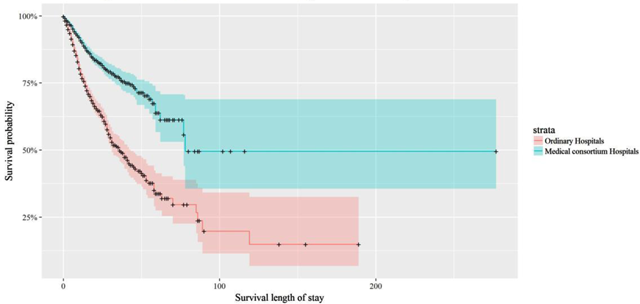
Figure 1
Product-Limit Survival Estimates of Matched Full Sample Patients.

Figure 2
Product-Limit Survival Estimates of 3 Matched Cancer Patients Lung Cancer Patients.
Note: Strata = 0 denotes patients enrolled in non-Medical Consortium Hospitals, strata = 1 denotes patients enrolled in Medical Consortium Hospitals.
Table 2
Maximum likelihood estimates of multivariable Cox hazard model.
| Parameter | Lung cancer | Stomach cancer | Esophageal cancer | |||||||||
|---|---|---|---|---|---|---|---|---|---|---|---|---|
| Hazard Ratio | Pr > ChiSq | 95% Hazard Ratio Confidence Limits | Hazard Ratio | Pr > ChiSq | 95% Hazard Ratio Confidence Limits | Hazard Ratio | Pr > ChiSq | 95% Hazard Ratio Confidence Limits | ||||
| Non-medical consortium hospitals | Ref. | Ref. | Ref. | Ref. | Ref. | Ref. | Ref. | Ref. | Ref. | Ref. | Ref. | Ref. |
| Medical consortium hospitals | 0.533 | <.001 | 0.439 | 0.648 | 0.494 | <.001 | 0.386 | 0.634 | 0.505 | <.001 | 0.361 | 0.708 |
| Age groups: | ||||||||||||
| 18–44 | Ref. | Ref. | Ref. | Ref. | Ref. | Ref. | Ref. | Ref. | Ref. | Ref. | Ref. | Ref. |
| 45–54 | 1.122 | 0.693 | 0.633 | 1.990 | 0.847 | 0.595 | 0.460 | 1.560 | 0.244 | 0.065 | 0.055 | 1.089 |
| 55–64 | 1.075 | 0.792 | 0.627 | 1.843 | 0.697 | 0.210 | 0.396 | 1.226 | 0.168 | 0.017 | 0.039 | 0.727 |
| 65–74 | 1.132 | 0.650 | 0.662 | 1.934 | 0.801 | 0.427 | 0.463 | 1.385 | 0.214 | 0.039 | 0.049 | 0.924 |
| 75–84 | 1.329 | 0.311 | 0.767 | 2.304 | 0.680 | 0.202 | 0.376 | 1.229 | 0.257 | 0.071 | 0.059 | 1.125 |
| >85 | 1.224 | 0.542 | 0.640 | 2.341 | 0.913 | 0.815 | 0.424 | 1.964 | 0.513 | 0.428 | 0.098 | 2.673 |
| Gender | ||||||||||||
| Female | Ref. | Ref. | Ref. | Ref. | Ref. | Ref. | Ref. | Ref. | Ref. | Ref. | Ref. | Ref. |
| Male | 0.895 | 0.247 | 0.742 | 1.080 | 0.907 | 0.493 | 0.685 | 1.200 | 1.134 | 0.439 | 0.825 | 1.557 |
| Status upon admission | ||||||||||||
| Ordinary | Ref. | Ref. | Ref. | Ref. | Ref. | Ref. | Ref. | Ref. | – | – | – | – |
| Acute | 5.657 | <.001 | 2.492 | 12.841 | 7.902 | 0.041 | 1.086 | 57.506 | – | – | – | – |
| Urgent | 2.696 | <.0001 | 1.750 | 4.155 | 2.447 | 0.010 | 1.236 | 4.843 | – | – | – | – |
| Surgery conducted or not | 0.543 | 0.023 | 0.320 | 0.921 | 0.596 | 0.006 | 0.411 | 0.864 | 1.307 | 0.334 | 0.760 | 2.248 |
| C3 Index | 0.994 | 0.935 | 0.856 | 1.153 | 0.981 | 0.875 | 0.769 | 1.251 | 0.970 | 0.818 | 0.750 | 1.255 |
| No. of open beds | 0.998 | <.001 | 0.997 | 0.999 | 0.998 | 0.002 | 0.996 | 0.999 | 0.999 | 0.209 | 0.997 | 1.001 |
| No. of regular budget physicians | 1.006 | <.001 | 1.003 | 1.008 | 1.009 | 0.000 | 1.004 | 1.014 | 1.004 | 0.196 | 0.998 | 1.009 |
| No. of extra contracted physicians | 1.013 | <.001 | 1.008 | 1.018 | 1.009 | 0.065 | 0.999 | 1.018 | 0.998 | 0.765 | 0.986 | 1.010 |
| No. of regular budget nurses | 0.995 | <.001 | 0.993 | 0.998 | 0.989 | <.001 | 0.984 | 0.993 | 0.997 | 0.242 | 0.991 | 1.002 |
| No. of extra contracted nurses | 0.993 | <.001 | 0.991 | 0.995 | 0.999 | 0.531 | 0.995 | 1.002 | 0.997 | 0.192 | 0.993 | 1.001 |
| Interaction | 1.010 | 0.002 | 1.004 | 1.016 | 1.019 | 0.014 | 1.004 | 1.035 | – | – | – | – |
[i] Ref. denotes the reference group;
The interaction term is the product of the variable that does not meet the proportional hazard assumption and the survival time variable.