
Table 1
Sociodemographic data of participants in the quantitative phase of the study.
| Participants | DF | GH | Total | p-value | ||||
|---|---|---|---|---|---|---|---|---|
| Number of participants | N = 141 | N = 142 | 283 | |||||
| N | N% | N | N% | N | N% | |||
| Age (years) | Mean = 72 (SD = 6) | Mean = 77 (SD = 7) | Mean = 74.42 (SD = 7.26) | >0.001 | ||||
| Gender | Male | 46 | 33.3% | 49 | 34.0% | 95 | 33.6% | |
| Female | 92 | 66.7% | 95 | 66.0% | 187 | 66.1% | n.s. | |
| Family status | Single | 10 | 7.2% | 16 | 11.1% | 26 | 9.18% | |
| Married | 68 | 49.3% | 59 | 41.0% | 127 | 44.9% | ||
| Widowed | 27 | 19.6% | 34 | 23.6% | 61 | 21.6% | ||
| Divorced/Living apart | 32 | 23.2% | 32 | 22.2% | 64 | 22.6% | n.s. | |
| Non-marital partnerships | 0 | 0.0% | 3 | 2.1% | 3 | 1.1% | ||
| Missing | 1 | 0.7% | 0 | 0.0% | 1 | 0.4% | ||
| Housing | Private home | 134 | 97.1% | 137 | 95.1% | 271 | 95.8% | |
| Assisted living | 3 | 2.2% | 4 | 2.8% | 7 | 2.5% | ||
| Retirement and nursing homes | 1 | 0.7% | 1 | 0.7% | 2 | 0.7% | n.s. | |
| Missing | 0 | 0.0% | 2 | 1.4% | 2 | 0.7% | ||
| School Education | None | 0 | 0.0% | 3 | 2.1% | 3 | 1.1% | |
| Primary school | 25 | 18.0% | 50 | 34.7% | 75 | 26.5% | ||
| Secondary school | 25 | 18.0% | 50 | 25.7% | 62 | 21.9% | ||
| Specialized secondary education | 23 | 16.5% | 13 | 9.0% | 36 | 12.7% | >0.001 | |
| Vocational secondary education | 66 | 47.5% | 39 | 27.1% | 105 | 37.1% | ||
| Other | 0 | 0.0% | 1 | 0.7% | 1 | 0.4% | ||
| Professional Education | No | 1 | 0.7% | 21 | 14.6% | 22 | 7.8% | |
| Professional training | 30 | 22.1% | 65 | 45.1% | 95 | 33.6% | ||
| Advanced professional training | 28 | 20.6% | 17 | 11.8% | 45 | 15.9% | >0.001 | |
| University of Applied Sciences degree | 26 | 19.1% | 20 | 13.9% | 46 | 16.3% | ||
| University degree | 48 | 35.3% | 20 | 13.9% | 68 | 24.0% | ||
| Other | 3 | 2.2% | 1 | 0.7% | 4 | 1.4% | ||
| Occupational status | Employee | 94 | 68.1% | 106 | 74.6% | 200 | 70.7% | |
| Civil Servant | 17 | 12.3% | 11 | 7.7% | 28 | 9.9% | ||
| Self-employed/freelancer | 11 | 8.0% | 11 | 7.7% | 22 | 7.8% | n.s. | |
| Home keeper | 7 | 5.1% | 11 | 7.7% | 18 | 6.4% | ||
| Other | 9 | 6.5% | 3 | 2.1% | 12 | 4.2% | ||
[i] Abbr. DF: Disability-free; GH: Geriatric Hospital; N: Number of participants; n.s.: non-significant; SD: standard deviation.
Table 2
Objective and subjective health status of the participants.
| Participants | DF | GH | Total | p-value | ||||
|---|---|---|---|---|---|---|---|---|
| Number of participants | N = 141 | N = 142 | 283 | |||||
| N | N% | N | N% | N | N% | |||
| Care Insurance Utilization | Yes | 2 | 1.5% | 39 | 27.3% | 41 | 14.5% | >0.001 |
| No | 131 | 97.0% | 89 | 62.2% | 220 | 77.8% | ||
| Applied for | 1 | 0.7% | 12 | 8.4% | 13 | 4.6% | ||
| Disability | Yes | 101 | 74.3% | 65 | 45.1% | 166 | 58.7% | >0.001 |
| No | 32 | 23.5% | 74 | 51.4% | 106 | 37.5% | ||
| Number of medications | M = 2 (SD 2) | M = 9 (SD 5) | M = 11 (SD 7) | >0.001 | ||||
| MD = 2 | MD = 9 | MD = 11 | ||||||
| Number of diseases and chronic conditions | M = 4.49 (SD 3.34) | M = 5.06 (SD 3.56) | M = 4.78 (SD 3.46) | n.s. | ||||
| MD = 4.00 | MD = 4.50 | MD = 4.00 | ||||||
| Subjective perception of health | Bad | 4 | 3.0% | 35 | 24.5% | 39 | 13.8% | >0.001 |
| Less well | 19 | 14.3% | 75 | 52.4% | 94 | 33.2% | ||
| Good | 92 | 69.2% | 32 | 22.4% | 124 | 43.1% | ||
| Very good | 18 | 13.5% | 1 | 0.7% | 19 | 6.7% | ||
[i] Abbr. DF: Disability-free; GH: Geriatric Hospital; M: mean value; MD: median value; N: Number of participants; n.s.: non-significant; SD: standard deviation.
Table 3
Participation and information desire in both groups.
| Participants | DF | GC | Total | p-value |
|---|---|---|---|---|
| Desire for participation (Mean/SD) | 47.02/26.40 | 32.05/26.47 | 40.44/27.41 | <0.001 |
| Desire for information (Mean/SD) | 93.75/11.86 | 95.15/8.40 | 94.37/10.46 | n.s. |
[i] Abr.: DF: Disability-free; GH: Geriatric Hospital; n.s.: non-significant; SD: Standard Deviation.
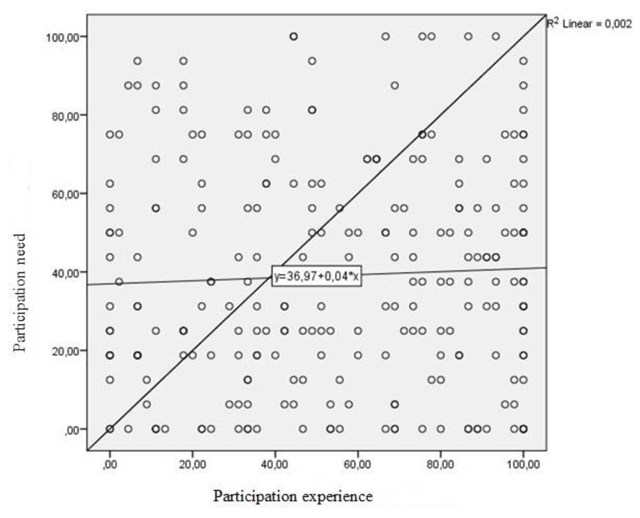
Figure 1
Correlation between participation desire and experience of all participants.