
Table 1
Description of the sample under study (N = 714).
| Feature | Mean or Percentage |
|---|---|
| Age | 78.5 |
| % > 75 years old | 69.3 % |
| % of women | 50.7 % |
| #Systems affected | 4.95 |
| #Organ systems affected per patient | 8 |
| Cardiology | 73.2 % |
| Cancer | 24.6 % |
| Diabetes | 47.5 % |
| Pulmonary | 36.9 % |
| Community Assessment Risk Screen1 | 5.53 |
| % CARS > 4 | 71.3 % |
| Mortality | 21.6 % |
[i] 1 The Community Assessment Risk Screen (CARS) is a tool for identifying community dwelling elderly patients at increased risk (CARS > 4) for hospitalizations or emergency room visits [36].
Table 2
Hospital resource utilization normalized for one year.
| Outcome | Pre-intervention | CM Intervention | ||||
|---|---|---|---|---|---|---|
| Min | Mean | Max | Min | Mean | Max | |
| Days of follow-up | – | 365 | – | – | 365 | – |
| Emergency room visits | 0 | 2.54 | 17 | 0 | 1.87 | 16.92 |
| Unplanned admissions | 0 | 1.01 | 9 | 0 | 0.58 | 7.69 |
| LoS due to unplanned admissions | 0 | 10.21 | 248 | 0 | 5.31 | 103.82 |
| HaH admissions | 0 | 0.68 | 10 | 0 | 1.02 | 23.84 |
| LoS at HaH | 0 | 9.19 | 82 | 0 | 4.38 | 74.60 |
Table 3
Original values for hospital resource utilization after the CM intervention.
| Outcome | CM Intervention | ||
|---|---|---|---|
| Min | Mean | Max | |
| Days of follow-up | 2 | 474.6 | 1102 |
| Emergency room visits | 0 | 2.43 | 22 |
| Unplanned admissions | 0 | 0.76 | 10 |
| LoS due to unplanned admissions | 0 | 6.91 | 135 |
| HaH admissions | 0 | 1.32 | 31 |
| LoS at HaH | 0 | 5.70 | 97 |
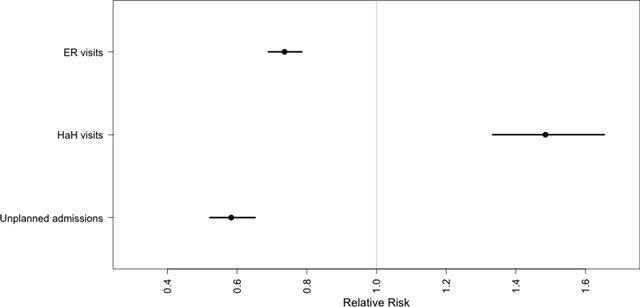
Figure 1
The relative risks and 95% confidence interval for unplanned hospital admission, HaH episodes, and visits to the Emergency room.