
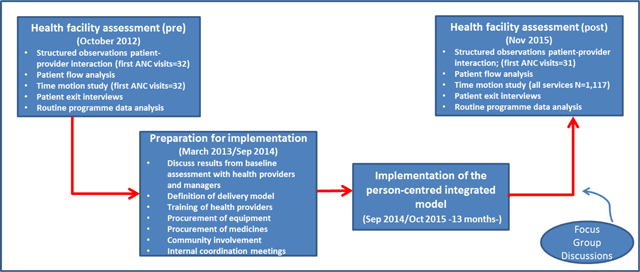
Figure 1
Phases of the study.
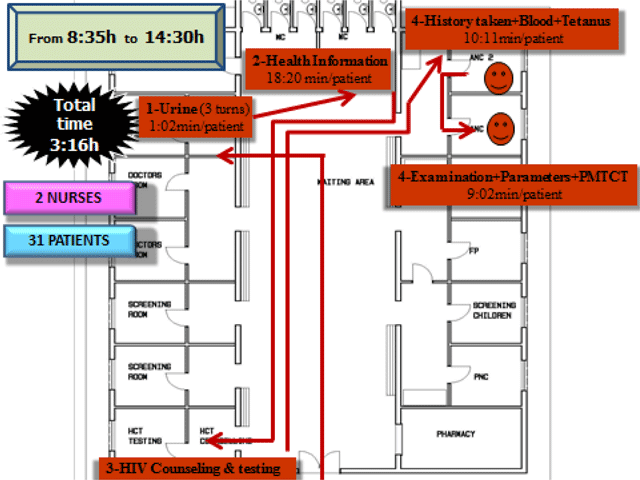
Figure 2
Time motion first antenatal care patients in Epako clinic (health facility baseline assessment).
Table 1
Steps followed to prepare for the implementation of the new person-centred integrated model of health service delivery in Epako Clinic, Namibia.
| Step 1. To inform and involve the Omaheke Regional office, the Gobabis Health District and the management in Epako clinic in conducting the study to create some buy in. |
| Step 2. To show the results from the assessment to Epako’s health workers, managers from Gobabis health district and Omaheke Region. Presentation of results raised awareness among health staff and managers about the problems and key bottlenecks on how they were providing health services. At the same time, a better understanding and interest of the new integrated model was created. |
| Step 3. To conduct a one day workshop with health workers from Epako clinic and some managers from the district and region on how to re-arrange health services in the clinic by following the new integrated model. New ideas and practical solutions were suggested by health staff from Epako on how to re-organize services. For example nurses decided the room they wanted to be in, which priority trainings were needed by each nurse, what equipment was needed and which medicines and M&E books were needed in each consulting room. After decisions were agreed on, a role play was performed to fully understand what the new model looked like. |
| Step 4. Training health staff on the required priority trainings. Some trainings took place outside the clinic, such as the Integrated Management of Adolescent and Adult Illness training and others within the clinic (in service training). In this case, experienced nurses taught other nurses how to perform, for example, a pap-smear, how to complete the HIV M&E register book, how to explore a ANC patient, etc. All these skills were learnt by nurses during their nursing studies but by serving only certain specialized care it made necessary to refresh them on these areas. |
| Step 5. To get the minimum new equipment needed in each consultation room. |
| Step 6. To undertake internal preparations within the clinic before starting the new integrated model. Internal meetings were organized to discuss how some specific aspects or problems could be sorted out. For example how to collect drugs from the pharmacy to the consulting room, how to share some vaccines that can only be reconstitute for one day, how to deal with TB patients, how to transport HIV records without compromising confidentiality, etc. Epako health workers took the lead at this stage and showed a high level of commitment, motivation and knowledge about the new integrated model. |
| Step 7. To involve the community. Church pastors and community leaders were briefed about the new model and they transmitted the information to the communities. This was proved to be a very effective way of reaching the community. |
| Step 8. To start the provision of services following the new system. During the first two weeks UNFPA, UNAIDS, WHO and MoHSS provided technical support within the clinic. New adjustments were made based on new challenges identified. Nurses supported each other by sharing technical knowledge and skills with their colleagues. It was frequent to see a nurse asking another nurse on how best to do something. At the end of the day these challenges and positive experiences were shared in “team” meetings where all nurses felt free to express themselves and share their experiences and solutions. |
Table 2
Health services provided per day, by health provider and by room in Epako clinic (pre-baseline assessment).
| Health services | Mon | Tue | Wed | Thu | Fri | Where | Health provider |
|---|---|---|---|---|---|---|---|
| First antenatal care | X | Antenatal care room | Nurse 1 | ||||
| Antenatal care follow up | X | X | X | Antenatal care room | Nurse 1 | ||
| Postnatal care | X | X | X | X | X | Immunisation room | Nurse 2 |
| Immunization | X | X | X | X | X | Immunisation room | Nurse 2 |
| Family planning | X | X | X | X | X | Family planning room | Nurse 3 |
| Outpatients (adults) | X | X | X | X | X | Adult outpatients room | Nurse 4 |
| Outpatients (children) | X | X | X | X | X | Child outpatient room | Nurse 5 |
| HIV counseling and testing | X | X | X | X | X | HCT room | 2 community counselors |
| Antiretroviral provision | X | X | X | X | X | HIV clinic | 3 nurses + 1 medical doctor + 2 community counselors |
| Tuberculosis | X | X | X | X | X | TB room | Nurse 6 |
| Dressing | X | X | X | X | X | Dressing room | Nurse 7 |
| Pap smear | X | X | X | X | X | Antenatal care room | Nurse 1 |
Table 3
Time motion indicators, nurse productivity and satisfaction for first antenatal care (ANC) in Epako clinic (times expressed in hour:min).
| Indicator | Before implementation of integrated model | After starting implementing the integrated model | Difference | % change |
|---|---|---|---|---|
| Total time in the clinic by first ANC patient | 03:05 | 02:35 | 00:30 | –16.4%* |
| Time inside the first ANC room by patient | 00:36 | 00:20 | 00:16 | –45.4%** |
| Time inside the HCT room by first ANC patient | 00:25 | 00:29 | –00:04 | 16.0%* |
| Time in the waiting area by first ANC patient | 02:03 | 01:46 | 00:17 | –14.4%NS |
| Expected time to be at the clinic by first ANC patient | 02:48 | 02:08 | 00:40 | –23.9%* |
| Nurse productivity in first ANC (# patients per nurse per hour) | 1.6 | 3.0 | 1.4 | 85.2%*** |
| Time to reach the clinic by first ANC patient | No data | 00:41 | N/A | N/A |
| Satisfaction by first ANC patient (4 Very good; 3 Good; 2 Poor; 1 Very poor) | 3.20 | 3.13 | –0.07 | –2.2%NS |
[i] *p<0.05; **p<0.001; ***p<0.001; NS-Not significant.
Table 4
Utilization of services (average per month) in Epako clinic before and after the implementation of the person-centered integrated model.
| INDICATOR | Before implementation of integrated services (from Jan 2012 to Aug 2014) | After starting implementation of integrated services (from Oct 2014 to Oct 2015) | Balance | % change |
|---|---|---|---|---|
| Average number of first ANC patients | 95.5 | 95.5 | 0.0 | 0.0% |
| ANC follow-up visits | 335.3 | 177.9 | –157.4 | –46.9% |
| Postnatal care visits | 71.5 | 60.0 | –0.2 | –16.0% |
| Family planning first visits | 31.3 | 37.4 | 6.1 | 19.5% |
| Family planning follow-up visits | 635.6 | 571.0 | –64.6 | –10.2% |
| Under 5 screening first visits | 394.2 | 349.1 | –0.1 | –11.4% |
| >18 years screening first visits | 784.1 | 696.5 | –0.1 | –11.2% |
| Total screening re-visits, follow-up | 481.7 | 1007.1 | 525.4 | 109.1% |
| Pap Smear per month | 18.6 | 13.5 | –5.2 | –27.7% |
| New malnutrition cases | 10.0 | 10.4 | 0.4 | 3.8% |
| TB treatment cure rate* | 96.3% | 97.0% | 0.7% | 0.7% |
| TB treatment success rate | 96.3% | 97.0% | 0.7% | 0.7% |
| New HIV patients on antiretrovirals | 27.1 | 24 | –3.1 | –11.4% |
| Routine refills of antiretrovirals | 654.3 | 761.1 | 106.8 | 16.3% |
| HIV patients who stopped ARV treatment | 6.9 | 6.4 | –0.5 | –7.2% |
| HIV patients who deceased | 15 | 12 | –3.0 | –20.0% |
[i] * Reported every tremester (93.3% refers to the average rate of the 1st, 2nd & 3rd Trimester of 2014). 97.0% is for the 4th trimester 2014. This indicator is only possible to be collected after 12 months.