
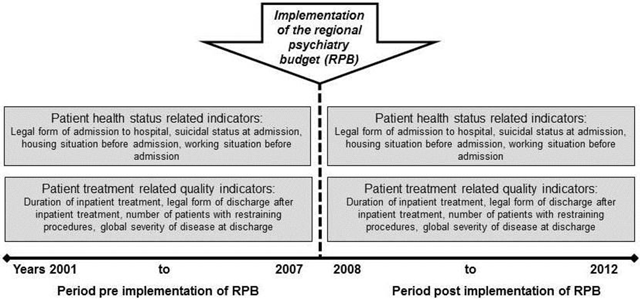
Figure 1
Pre-post comparison study design for evaluation of selected indicators of health status and quality of psychiatric care.
Table 1
Sociodemographic and clinical indicators of health status and social adjustment of psychiatric cases at time of admission before and after implementation of the Regional Psychiatry Budget (RPB) in the administrative District of Dithmarschen. P-values by Pearson’s Chi-Square, significance applies to the whole category values.
| Indicator | Years 2001–2007 | Years 2008–2012 | p-values |
|---|---|---|---|
| Legal form of admission (n per year, %) | <0.001 | ||
| Voluntary | 1,527.7(92.6) | 1,566.8 (95.4) | |
| Compulsory admission | 86.0 (5.2) | 50.8 (3.1) | |
| Prompted by legal guardian | 36.6 (2.2) | 18.6 (1.1) | |
| Other (e.g., underage) | 0 (0) | 5.8 (0.4) | |
| Suicidality at time of admission (n per year, %) | <0.001 | ||
| Not suicidal | 1,399.3 (84.7) | 1,537.6(93.2) | |
| Suicidal ideas | 193.9 (11.7) | 69.0 (4.2) | |
| Suicide attempt | 58.9 (3.6) | 42.8 (2.6) | |
| Housing situation at admission (n per year, %) | <0.001 | ||
| Living in own home | 1,319.1(80.3) | 1,416.6 (87.1) | |
| Assisted living | 293.6(17.9) | 188.2 (11.6) | |
| Homeless | 29.0 (1.8) | 21.8 (1.3) | |
| Working situation at admission (n per year, %) | <0.001 | ||
| Full time employment | 223.6 (14.5) | 269.0(22.9) | |
| Part time employment | 58.7 (3.8) | 40.4 (3.4) | |
| Sheltered employment | 104.1 (6.8) | 45.4 (3.9) | |
| Stay-at-home partner | 95.9 (6.2) | 38.6 (3.3) | |
| Unemployed | 465.7(30.3) | 333.8(28.4) | |
| Retired | 468.1(30.5) | 337.2(28.7) | |
| In education | 59.7 (3.9) | 61.8 (5.3) | |
| Other | 61.0 (4.0) | 49.4 (4.2) |
Table 2
Sociodemographic and clinical indicators of quality of psychiatric care of cases at discharge from hospital or day care before and after implementation of the Regional Psychiatry Budget (RPB) in the administrative District of Dithmarschen. P-values by Pearson’s Chi-Square.
| Indicator | Years 2001–2007 | Years 2008–2012 | p-values |
|---|---|---|---|
| Legal form of discharge (n per year, %) | <0.001 | ||
| Regular | 1,318.7(79.8) | 1,426.2(90.2) | |
| Against physician’s advice | 267.4(16.2) | 143.4 (9.1) | |
| Escaped | 60.7 (3.7) | 9.4 (0.6) | |
| Deceased | 5.1 (0.3) | 2.6 (0.2) | |
| Cases with restraining procedures necessary during inpatient stay (n per year, %) | <0.001 | ||
| Yes | 103.6 (6.3) | 52.2 (3.2) | |
| No | 1,544.6 (93.7) | 1,582.0 (96.8) | |
| Global estimation of response at discharge based on psychiatric assessment (n per year, %) | <0.001 | ||
| Improved | 1,364.3(82.9) | 1,501.0 (92.3) | |
| Unchanged | 247.0(15.0) | 91.6 (5.6) | |
| Worsened | 34.3 (2.1) | 33.8 (2.1) |
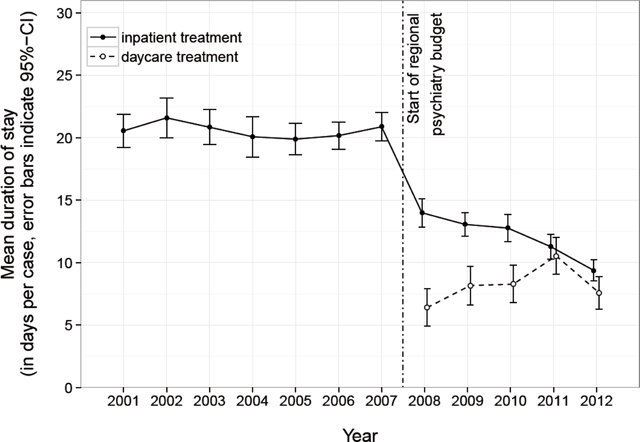
Figure 2
Mean duration of inpatient stay before and after implementation (dashed line) of the Regional Psychiatry Budget (RPB) in the administrative District of Dithmarschen.