
Table 1
Patients’ characteristics by chronic disease after propensity matching.
| Characteristic | Patients with diabetes n = 12,526 | Patients with cardiovascular diseases n = 71,778 | Patients with respiratory illnesses n = 17,498 |
|---|---|---|---|
| n (%) | n (%) | n (%) | |
| Population characteristics (2012) | |||
| Male | 7043 (56.2) | 33,716 (47.0) | 7686 (43.9) |
| Mean age (sd) | 67.1 (12.7) | 67.9 (13.5) | 56.7 (18.6) |
| Age group (years) | |||
| 18–44 | 677 (5.4) | 4063 (5.7) | 4848 (27.7) |
| 45–54 | 1236 (9.9) | 7307 (10.2) | 2551 (14.6) |
| 55–64 | 2683 (21.4) | 13,894 (19.4) | 2988 (17.1) |
| 65–74 | 4082 (32.6) | 21,536 (30.0) | 3797 (21.7) |
| 75–84 | 3167 (25.3) | 18,823 (26.2) | 2629 (15.0) |
| ≥85 | 681 (5.4) | 6155 (8.6) | 685 (3.9) |
| Region of residence | |||
| Lake Geneva | 823 (6.6) | 3666 (5.1) | 1986 (11.4) |
| Mittelland | 2586 (20.7) | 14,745 (20.5) | 3768 (21.5) |
| Northwest | 3240 (25.9) | 17,571 (24.5) | 3919 (22.4) |
| East | 2628 (21.0) | 14,982 (20.9) | 2808 (16.1) |
| Ticino | 10 (0.1) | 66 (0.1) | 26 (0.2) |
| Central | 465 (3.7) | 2727 (3.8) | 691 (4.0) |
| Zurich | 2774 (22.2) | 18,021 (25.1) | 4300 (24.6) |
| Health insurance status | |||
| Care model | |||
| Standard care model | 6263 (50.0) | 6263 (50.0) | 6263 (50.0) |
| Integrated care model | 6263 (50.0) | 6263 (50.0) | 6263 (50.0) |
| Deductible | |||
| High (>CHF500) | 608 (4.9) | 7575 (10.6) | 2521 (14.4) |
| Low (CHF300/500) | 11,918 (95.2) | 64,203 (89.5) | 14,977 (85.6) |
| Chronic Disease Score | |||
| Mean chronic disease score (sd) | 7053 (5679.7) | 5048 (4808.9) | 5702 (5366.3) |
| Level 1 (0–999) | 623 (5.0) | 11,757 (16.4) | 3437 (19.6) |
| Level 2 (1000–2499) | 2710 (21.6) | 12,977 (18.1) | 2707 (15.5) |
| Level 3 (2500–4999) | 2102 (16.8) | 17,126 (23.9) | 3539 (20.2) |
| Level 4 (5000–9999) | 4234 (33.8) | 21,347 (29.7) | 5169 (29.4) |
| Level 5 (≥10,000) | 2857 (22.8) | 8570 (11.4) | 2646 (15.1) |
| Hospitalisation (2011) | 2349 (18.8) | 12,049 (16.8) | 2749 (15.7) |
| No. of hospitalised days (2011) | |||
| Mean days (sd) | 3.2 (12.2) | 2.4 (9.7) | 2.2 (9.4) |
| 0–3 days | 10,604 (84.7) | 62,483 (87.1) | 15,440 (88.2) |
| 4–10 days | 969 (7.7) | 4826 (6.7) | 1149 (6.6) |
| >10 days | 953 (7.6) | 4469 (6.2) | 909 (5.2) |
[i] sd, standard deviation.
Table 2
Patients’ characteristics by chronic disease and care model (integrated vs standard) after propensity matching.
| Characteristic | Diabetes | Cardiovascular diseases | Respiratory illnesses | |||
|---|---|---|---|---|---|---|
| With ICM n = 6263 | With SCM n = 6263 | With ICM n = 35,889 | With SCM n = 35,889 | With ICM n = 8749 | With SCM n = 8749 | |
| n (%) | n (%) | n (%) | n (%) | n (%) | n (%) | |
| Population characteristics (2012) | ||||||
| Male | 3507 (56.0) | 3536 (56.5) | 16,913 (47.1) | 16,803 (46.8) | 3770 (43.1) | 3916 (44.8) |
| Mean age (sd) | 67.1 (12.8) | 67.1 (12.6) | 68.0 (13.5) | 67.8 (13.5) | 57.1 (18.9) | 56.3 (18.3) |
| Age group (years) | ||||||
| 18–44 | 355 (5.7) | 322 (5.1) | 2071 (5.8) | 1992 (5.6) | 2434 (27.8) | 2414 (27.6) |
| 45–54 | 615 (9.8) | 621 (9.9) | 3508 (9.8) | 3799 (10.6) | 1186 (13.6) | 1365 (15.6) |
| 55–64 | 1264 (20.2) | 1419 (22.7) | 6701 (18.7) | 7193 (20.0) | 1398 (6.0) | 1590 (18.2) |
| 65–74 | 2073 (33.1) | 2009 (32.1) | 11,024 (30.7) | 10,512 (29.3) | 1986 (22.7) | 1811 (20.7) |
| 75–84 | 1634 (26.0) | 1536 (24.5) | 9594 (26.7) | 9229 (25.7) | 1390 (15.9) | 1239 (14.2) |
| ≥85 | 325 (5.2) | 356 (5.7) | 2991 (8.3) | 3164 (8.8) | 355 (4.1) | 330 (3.8) |
| Region of residence | ||||||
| Lake Geneva | 407 (6.5) | 413 (6.6) | 1815 (5.1) | 1866 (5.2) | 952 (10.9) | 1032 (11.8) |
| Mittelland | 1297 (20.7) | 1290 (20.6) | 7340 (20.5) | 7393 (20.6) | 1877 (21.5) | 189 (21.6) |
| Northwest | 1636 (26.1) | 1603 (25.6) | 8880 (24.7) | 8685 (24.2) | 1992 (22.8) | 1925 (22.0) |
| East | 1307 (20.9) | 1321 (21.1) | 7506 (20.9) | 7465 (20.8) | 1442 (16.5) | 1365 (15.6) |
| Ticino | 5 (0.1) | 6 (0.1) | 33 (0.1) | 36 (0.1) | 13 (0.2) | 17 (0.2) |
| Central | 235 (3.8) | 232 (3.7) | 1370 (3.8) | 1364 (3.8) | 354 (4.1) | 341 (3.9) |
| Zurich | 1376 (22.0) | 1397 (22.3) | 8945 (27.9) | 9080 (25.3) | 2119 (24.2) | 2179 (24.9) |
| Health insurance status | ||||||
| Deductible | ||||||
| High (>CHF500) | 311 (5.0) | 297 (4.7) | 3844 (10.7) | 3731 (10.4) | 1276 (14.6) | 1245 (14.2) |
| Low (CHF300/500) | 5952 (95.0) | 5966 (95.3) | 32,045 89.3) | 32,158 (89.6) | 7473 (85.4) | 7504 (85.8) |
| Chronic Disease Score | ||||||
| Mean chronic disease score (sd) | 7141 (5860.7) | 6966 (5491.9) | 5122 (4928.4) | 4975 (4685.2) | 5844 (5560.4) | 5561 (5161.5) |
| Level 1 (0–999) | 302 (4.8) | 321 (5.1) | 5873 (16.4) | 5884 (16.4) | 1660 (19.0) | 1777 (20.3) |
| Level 2 (1000–2499) | 1326 (21.2) | 1384 (22.1) | 6396 (17.8) | 6585 (18.4) | 1330 (15.2) | 1377 (15.7) |
| Level 3 (2500–4999) | 1061 (16.9) | 1041 (16.6) | 8544 (23.8) | 8581 (23.9) | 1782 (20.4) | 1757 (20.1) |
| Level 4 (5000–9999) | 2129 (34.0) | 2105 (33.6) | 10,686 (29.8) | 10,659 (29.7) | 2638 (30.2) | 2531 (28.9) |
| Level 5 (≥10,000) | 1445 (23.1) | 1412 (22.6) | 4390 (12.2) | 4180 (11.7) | 1339 (15.3) | 1307 (14.9) |
| Hospitalisation (2011) | 1217 (19.4) | 1132 (18.1) | 6512 (18.1) | 5537 (15.4) | 1376 (15.7) | 1373 (15.7) |
| No. of hospitalised days (2011) | ||||||
| Mean days (sd) | 3.2 (12.4) | 3.1 (12.0) | 2.6 (10.4) | 2.2 (8.9) | 2.3 (10.3) | 2.0 (8.4) |
| 0–3 days | 5284 (84.4) | 5320 (84.9) | 30,896 (86.1) | 31,587 (88.0) | 7715 (88.2) | 7725 (88.3) |
| 4–10 days | 494 (7.9) | 475 (7.6) | 2678 (7.5) | 2148 (6.0) | 583 (6.7) | 566 (6.5) |
| >10 days | 485 (7.7) | 468 (7.5) | 2315 (6.5) | 2154 (6.0) | 451 (5.1) | 458 (5.2) |
[i] ICM, integrated care model; SCM, standard care model; sd, standard deviation.
Table 3
Disease-related hospitalisation frequencies by chronic disease and care model (integrated vs standard) after propensity matching.
| Hospitalisation | Diabetes | Cardiovascular diseases | Respiratory illnesses | |||
|---|---|---|---|---|---|---|
| With ICM n = 6263 | With SCM n = 6263 | With ICM n = 35,889 | With SCM n = 35,889 | With ICM n = 8749 | With SCM n = 8749 | |
| n (%) | n (%) | n (%) | n (%) | n (%) | n (%) | |
| Diabetes related cause of hospitalisation (total) | 1194 (19.1) | 1298 (20.7) | ||||
| Diabetes mellitus | 1135 (18.1) | 1229 (19.6) | ||||
| Renal failure | 383 (6.1) | 377 (6.0) | ||||
| Retinal disorder and cataract | 12 (0.2) | 24 (0.4) | ||||
| Ischaemic heart disease | 366 (5.8) | 382 (6.1) | ||||
| Cerebrovascular disease | 74 (1.2) | 83 (1.3) | ||||
| Atherosclerosis | 126 (2.0) | 147 (2.4) | ||||
| Diabetic peripheral angiopathy | 39 (0.6) | 52 (0.8) | ||||
| Diabetic monoeuropathy | 1 (0.02) | 1 (0.02) | ||||
| Diabetic polyneuropathy | 60 (1.0) | 67 (1.1) | ||||
| Cardiovascular disease-related cause of hospitalisation (total) | 5273 (14.7) | 5508 (15.4) | ||||
| Hypertensive disease | 4428 (12.3) | 4673 (13.0) | ||||
| Ischaemic heart disease | 1537 (4.3) | 1566 (4.4) | ||||
| Pulmonary heart disease and diseases of pulmonary circulation | 245 (0.7) | 273 (0.8) | ||||
| Other form of heart diseases | 1655 (4.6) | 1706 (4.8) | ||||
| Cerebrovascular disease | 339 (0.9) | 367 (1.0) | ||||
| Atherosclerosis, aortic aneurysm and dissection and other aneurysm and dissection | 509 (1.4) | 589 (1.6) | ||||
| Peripheral vascular disease, unspecified | 54 (0.2) | 46 (0.1) | ||||
| Arterial embolism and thrombosis | 54 (0.2) | 72 (0.2) | ||||
| Respiratory illness-related cause of hospitalisation (total) | 602 (6.9) | 594 (6.8) | ||||
| Simple and mucopurulent chronic bronchitis | 4 (0.1) | 3 (0.03) | ||||
| Unspecified chronic bronchitis | 12 (0.1) | 9 (0.1) | ||||
| Emphysema | 9 (0.1) | 6 (0.1) | ||||
| Other chronic obstructive pulmonary disease | 419 (4.8) | 404 (4.6) | ||||
| Asthma | 174 (2.0) | 194 (2.2) | ||||
| Status asthmaticus | 2 (0.02) | 5 (0.1) | ||||
| Bronchiectasis | 14 (0.2) | 7 (0.1) | ||||
[i] ICM, integrated care model; SCM, standard care model.
Table 4
Total healthcare costs by chronic disease and care model (integrated vs standard) after propensity matching.
| Hospitalisation | Diabetes | Cardiovascular diseases | Respiratory illnesses | ||||||
|---|---|---|---|---|---|---|---|---|---|
| Total | With ICM n = 6263 | With SCM n = 6263 | Total | With ICM n = 35,889 | With SCM n = 35,889 | Total | With ICM n = 8749 | With SCM n = 8749 | |
| CHF | CHF | CHF | CHF | CHF | CHF | CHF | CHF | CHF | |
| Total healthcare costs (mean, standard deviation) | 10,000 (14379.7) | 9466 (13418.6) | 10,530 (15263.0) | 7842 (13063.5) | 7502 (12186.2) | 8182 (13877.4) | 7679 (14664.5) | 7428 (13164.8) | 7929 (16021.2) |
[i] ICM, integrated care model; SCM, standard care model.
Table 5
Prediction of disease-related hospitalisation by chronic disease on the propensity-matched cohort.
| Characteristic | Hospitalisation (2013) | |||||
|---|---|---|---|---|---|---|
| Diabetes | Cardiovascular diseases | Respiratory illnesses | ||||
| Odds ratio | 95% confidence interval | Odds ratio | 95% confidence interval | Odds ratio | 95% confidence interval | |
| Population characteristics | ||||||
| Gender | ||||||
| Male | 1.00 | 1.00 | 1.00 | |||
| Female | 0.79*** | 0.72–0.87 | 0.75*** | 0.72–0.78 | 0.64*** | 0.57–0.73 |
| Age group (years) | ||||||
| 18–44 | 1.00 | 1.00 | 1.00 | |||
| 45–54 | 1.49* | 1.06–2.10 | 2.26*** | 1.84–2.78 | 1.99*** | 1.37–2.89 |
| 55–64 | 1.90*** | 1.39–2.60 | 3.42*** | 2.83–4.14 | 4.31*** | 3.12–5.96 |
| 65–74 | 2.47*** | 1.82–3.36 | 5.11*** | 4.24–6.16 | 6.54*** | 4.80–8.92 |
| 75–84 | 3.57*** | 2.62–4.85 | 7.25*** | 6.01–8.73 | 7.15*** | 5.21–9.82 |
| ≥85 | 5.11*** | 3.64–7.16 | 10.45*** | 8.62–12.65 | 9.19*** | 6.41–13.17 |
| Region of residence | ||||||
| Lake Geneva | 1.00 | 1.00 | 1.00 | |||
| Mittelland | 1.91*** | 1.49–2.44 | 2.11*** | 1.84–2.43 | 1.75*** | 1.27–2.40 |
| Northwest | 2.22*** | 1.74–2.83 | 2.53*** | 2.21–2.91 | 2.12*** | 1.55–2.90 |
| East | 2.21*** | 1.73–2.83 | 2.41*** | 2.09–2.77 | 2.02*** | 1.46–2.79 |
| Ticino | 6.62** | 1.84–23.78 | 1.82 | 0.89–3.71 | 2.85 | 0.77–10.60 |
| Central | 1.90*** | 1.37–2.64 | 2.20*** | 1.85–2.62 | 1.67* | 1.07–2.62 |
| Zurich | 1.93*** | 1.50–2.46 | 2.34*** | 2.04–2.69 | 2.10*** | 1.54–2.87 |
| Health insurance status | ||||||
| Care model | ||||||
| Standard care model | 1.00 | 1.00 | 1.00 | |||
| Integrated care model | 0.87** | 0.79–0.95 | 0.92*** | 0.88–0.96 | 0.95 | 0.84–1.07 |
| Deductible | ||||||
| Low (CHF 300/500) | 1.00 | 1.00 | 1.00 | |||
| High (>CHF500) | 0.89 | 0.70–1.13 | 0.79*** | 0.73–0.86 | 0.56*** | 0.42–0.75 |
| Chronic Disease Score | ||||||
| Level 1 (0–999) | 1.00 | 1.00 | 1.00 | |||
| Level 2 (1000–2499) | 1.33 | 0.96–1.84 | 1.25*** | 1.14–1.36 | 1.15 | 0.81–1.63 |
| Level 3 (2500–4999) | 1.66** | 1.20–2.32 | 1.49*** | 1.37–1.61 | 1.51** | 1.11–2.05 |
| Level 4 (5000–9999) | 2.33*** | 1.69–3.20 | 2.02*** | 1.87–2.18 | 1.93*** | 1.44–2.58 |
| Level 5 (≥10,000) | 3.51*** | 2.55–4.84 | 2.92*** | 2.68–3.18 | 3.05*** | 2.264–4.12 |
| No. of hospitalised days (2011) | ||||||
| 0–3 days | 1.00 | 1.00 | 1.00 | |||
| 4–10 days | 1.28** | 1.10–1.50 | 1.47*** | 1.37–1.59 | 1.77*** | 1.46–2.15 |
| >10 days | 1.92*** | 1.66–2.23 | 1.88*** | 1.75–2.02 | 2.66*** | 2.22–3.19 |
[i] *p < 0.05; **p < 0.01; ***p < 0.01.
Table 6
Prediction of total healthcare costs by chronic disease on the propensity-matched cohort.
| Characteristic | Healthcare costs (2013) | |||||
|---|---|---|---|---|---|---|
| Diabetes | Cardiovascular diseases | Respiratory illnesses | ||||
| Estimate CHF | 95% confidence interval | Estimate CHF | 95% confidence interval | Estimate CHF | 95% confidence interval | |
| Population characteristics | ||||||
| Gender | ||||||
| Male | Ref. | Ref. | Ref. | |||
| Female | –669.1*** | –933.3 to –403.4 | –412.2*** | –499.0 to –325.8 | 284.0*** | 166.3–402.3 |
| Age group (years) | ||||||
| 18–44 | Ref. | Ref. | Ref. | |||
| 45–54 | –769.7** | –1308.6 to –248.5 | 213.4** | 59.9–364.6 | 220.4** | 65.7–386.0 |
| 55–64 | –84.5 | –632.4–438.5 | 431.2*** | 284.9–573.9 | 1127.3*** | 896.3–1373.2 |
| 65–74 | 740.1** | 190.0–1264.2 | 1242.4*** | 1090.0–1391.7 | 1942.7*** | 1642.0–2259.3 |
| 75–84 | 1850.8*** | 1252.8–2430.5 | 2300.5*** | 2126.5–2473.1 | 2655.6*** | 2230.1–3108.7 |
| ≥85 | 3379.8*** | 2447.3–4370.3 | 3499.8*** | 3226.6–3780.0 | 3368.2*** | 4338.1–2517.0 |
| Region of residence | ||||||
| Lake Geneva | Ref. | Ref. | Ref. | |||
| Mittelland | –555.5 | –1138.5 to –10.6 | –221.6* | –436.4 to –17.0 | –9.9 | –209.0 to 180.6 |
| Northwest | 188.5 | –396.6 to 735.4 | –262.4* | –476.4 to –58.5 | 225.3* | 11.7–435.9 |
| East | 61.2 | –535.0 to 622.1 | –522.2*** | –737.1 to –317.2 | –251.9* | –454.7 to –53.1 |
| Ticino | 6705.3 | –1399.7 to 25930.6 | –1006.0 | –2111.3 to 962.9 | –944.6*** | –506.6 to –1227.3 |
| Central | 81.5 | –740.1 to 948.0 | –283.4* | –548.6 to –17.4 | –68.5 | –326.1 to 217.4 |
| Zurich | –96.4 | –687.6 to 457.9 | 12.7 | –202.7 to 218.2 | 145.4 | –56.3 to 340.4 |
| Health insurance status | ||||||
| Care model | ||||||
| Standard care model | Ref. | Ref. | Ref. | |||
| Integrated care model | –777.8*** | –1040.8 to –516.5 | –441.3*** | –527.3 to –355.6 | –217.9*** | –340.2 to –96.6 |
| Deductible | ||||||
| Low (CHF 300/500) | Ref. | Ref. | Ref. | |||
| High (>CHF500) | –344.2 | –819.8 to 180.2 | –1051.0*** | –1150.7 to –950.0 | –1266.0*** | –1407.7 to –1127.0 |
| Chronic disease score | ||||||
| Level 1 (0–999) | Ref. | Ref. | Ref. | |||
| Level 2 (1000–2499) | 642.2** | 205.0–1060.8 | 861.4*** | 749.1–974.9 | 1054.1*** | 878.1–1238.6 |
| Level 3 (2500–4999) | 2189.6*** | 1698.1–2674.4 | 2019.8*** | 1894.5–2146.2 | 1855.1*** | 1628.2–2090.9 |
| Level 4 (5000–9999) | 3750.8*** | 3271.0–4216.0 | 4405.9*** | 4251.7–4561.7 | 4820.9*** | 4489.9–5161.5 |
| Level 5 (≥10,000) | 10022.8*** | 9322.7–10734.6 | 11260.3*** | 10877.5–11654.4 | 11960.6*** | 11197.6–12766.9 |
| No. of hospitalised days (2011) | ||||||
| 0–3 days | Ref. | Ref. | Ref. | |||
| 4–10 days | 2809.3*** | 2106.0–3575.4 | 1768.7*** | 1506.2–2044.2 | 1644.4*** | 1137.8–2223.9 |
| >10 days | 6260.6*** | 5206.3–7407.3 | 5030.8*** | 4592.6–5489.8 | 7079.3*** | 5810.9–8492.1 |
[i] Ref., reference.
*p < 0.05; **p < 0.01; ***p < 0.01.
Table A1
Classification of patients with chronic diseases
| Chronic disease | Identification via ATC code | Identification via ICD-10 code |
|---|---|---|
| Diabetes mellitus | A10A, A10B, A10X | E10–14 |
| Cardiovascular diseases | B01AA, B01AC, B01AX, B01AE07, C01–03, C04A, C07–09 | I10–I15, I20–I25, I26–I28, I47–I50, I61–I66, I67.0, I67.2, I67.4, I70–72, I73.9, I74 |
| Respiratory illnesses | R03 | J41–46 |
Table A2
Classification of disease-related hospitalisations.
| Chronic disease | Disease-related hospitalisation according ICD-10 classification |
|---|---|
| Diabetes mellitus | E10–E14, I20–I25, I61–I66, I67.0, I67.2, I67.4, N17–N19, N08.3, H28.0, H36.0, I70, I79.2, G59.0, G63.2 |
| Cardiovascular diseases | I10–I15, I20–I28, I47–I50, I61–I66, I67.0, I67.2, I67.4, I70–I72, I73.9, I74 |
| Respiratory illnesses | J41–J47 (excl. J43.0) |
Table A3
Patients characteristics by chronic disease before propensity-matching.
| Characteristic | Patients with diabetes n = 36,532 | Patients with cardiovascular diseases n = 186,986 | Patients with respiratory illnesses n = 45,364 |
|---|---|---|---|
| n (%) | n (%) | n (%) | |
| Population characteristics (2012) | |||
| Male | 20052 (54.9) | 85832 (45.9) | 19447 (42.9) |
| Mean age (sd) | 67.2 (13.0) | 68.2 (13.7) | 58.9 (18.1) |
| Age group (years) | |||
| 18–44 | 2033 (5.6) | 10455 (5.6) | 10447 (23.0) |
| 45–54 | 3739 (10.2) | 18727 (10.0) | 6633 (14.6) |
| 55–64 | 7929 (21.7) | 37159 (19.9) | 8302 (18.3) |
| 65–74 | 11059 (30.3) | 52590 (28.1) | 9970 (22.0) |
| 75–84 | 9376 (25.7) | 49459 (26.5) | 7714 (17.0) |
| ≥85 | 2396 (6.6) | 18596 (10.0) | 2298 (5.1) |
| Region of residence | |||
| Lake Geneva | 5465 (15.0) | 23980 (12.8) | 7203 (15.9) |
| Mittelland | 7208 (19.7) | 35900 (19.2) | 8601 (19.0) |
| Northwest | 5732 (15.7) | 29611 (15.8) | 7067 (15.6) |
| East | 4966 (13.6) | 26843 (14.4) | 5695 (12.6) |
| Ticino | 2539 (7.0) | 12355 (6.6) | 2879 (6.4) |
| Central | 2476 (6.8) | 1337 (7.1) | 3051 (6.7) |
| Zurich | 8146 (22.3) | 44960 (24.0) | 10868 (24.0) |
| Health insurance status | |||
| Integrated care model | 6263 (17.1) | 35889 (19.2) | 8749 (19.3) |
| Deductible | |||
| High (>CHF500) | 1775 (4.9) | 17125 (9.2) | 4951 (10.9) |
| Low (CHF300/500) | 34757 (94.1) | 169861 (90.8) | 40413 (89.1) |
| Chronic disease score (CDS) | |||
| Mean CDS (sd) | 7746 (6128.9) | 5713 (5250.8) | 6823 (6113.6) |
| Level 1 (0–999) | 1616 (4.4) | 25742 (13.8) | 6874 (15.2) |
| Level 2 (1000–2499) | 6880 (18.8) | 30316 (16.2) | 5922 (13.1) |
| Level 3 (2500–4999) | 5671 (15.5) | 42423 (22.7) | 8388 (18.5) |
| Level 4 (5000–9999) | 12394 (33.9) | 59855 (32.0) | 14736 (32.5) |
| Level 5 (≥10000) | 9971 (27.3) | 28650 (15.3) | 9444 (20.8) |
| Hospitalisation (2011) | 7564 (20.7) | 36747 (19.7) | 8952 (19.7) |
| No. of hospitalised days (2011) | |||
| Mean days (sd) | 3.7 (13.8) | 3.3 (12.8) | 3.4 (13.3) |
| 0–3 days | 30356 (83.1) | 157966 (84.5) | 38311 (84.5) |
| 4–10 days | 2827 (7.7) | 14028 (7.5) | 3387 (7.5) |
| >10 days | 3349 (9.2) | 14992 (8.0) | 3666 (8.1) |
Table A4
Results showing the effectiveness of the propensity score matching among patients with diabetes.
| Summary of balance for all data | |||||||
| Means Treated | Means Control | SD Control | Mean Diff | eQQ Med | eQQ Mean | eQQ Max | |
| Distance | 0.2134 | 0.1627 | 0.0854 | 0.0507 | 0.0583 | 0.0507 | 0.0942 |
| Age in years | 67.1062 | 67.2526 | 13.0728 | –0.1464 | 1 | 0.6077 | 3 |
| CDS | 7140.5362 | 7871.5302 | 6175.6716 | –730.9941 | 775 | 741.2724 | 4399 |
| Ded_high | 0.0497 | 0.0484 | 0.2145 | 0.0013 | 0 | 0.0013 | 1 |
| Geneva | 0.065 | 0.1671 | 0.3731 | –0.1021 | 0 | 0.1022 | 1 |
| Mittelland | 0.2071 | 0.1953 | 0.3964 | 0.0118 | 0 | 0.0118 | 1 |
| Northwest | 0.2612 | 0.1353 | 0.3421 | 0.1259 | 0 | 0.1258 | 1 |
| East | 0.2087 | 0.1209 | 0.326 | 0.0878 | 0 | 0.0878 | 1 |
| Ticino | 0.0008 | 0.0837 | 0.277 | –0.0829 | 0 | 0.083 | 1 |
| Central | 0.0375 | 0.074 | 0.2618 | –0.0365 | 0 | 0.0366 | 1 |
| Zurich | 0.2197 | 0.2237 | 0.4167 | –0.004 | 0 | 0.004 | 1 |
| No. of hospitalised days | 3.243 | 3.8468 | 14.0993 | –0.6038 | 0 | 0.6302 | 189 |
| Summary of balance for matched data | |||||||
| Means Treated | Means Control | SD Control | Mean Diff | eQQ Med | eQQ Mean | eQQ Max | |
| Distance | 0.2134 | 0.2134 | 0.068 | 0 | 0 | 0 | 4.00E-04 |
| Age in years | 67.1062 | 67.0564 | 12.551 | 0.0498 | 0 | 0.5307 | 4.00E+00 |
| CDS | 7140.5362 | 6966.2443 | 5491.9203 | 174.2919 | 27 | 178.753 | 1.67E+04 |
| Ded_high | 0.0497 | 0.0474 | 0.2126 | 0.0022 | 0 | 0.0022 | 1.00E+00 |
| Geneva | 0.065 | 0.0664 | 0.249 | –0.0014 | 0 | 0.0014 | 1.00E+00 |
| Mittelland | 0.2071 | 0.2058 | 0.4043 | 0.0013 | 0 | 0.0013 | 1.00E+00 |
| Northwest | 0.2612 | 0.2561 | 0.4365 | 0.0051 | 0 | 0.0051 | 1.00E+00 |
| East | 0.2087 | 0.2109 | 0.408 | –0.0022 | 0 | 0.0022 | 1.00E+00 |
| Ticino | 0.0008 | 0.0008 | 0.0282 | 0 | 0 | 0 | 0.00E+00 |
| Central | 0.0375 | 0.0367 | 0.1881 | 0.0008 | 0 | 0.0008 | 1.00E+00 |
| Zurich | 0.2197 | 0.2232 | 0.4164 | –0.0035 | 0 | 0.0035 | 1.00E+00 |
| No. of hospitalised days | 3.243 | 3.0838 | 12.0279 | 0.1592 | 0 | 0.179 | 2.50E+01 |
| Percent Balance Improvement | |||||||
| Mean Diff. | eQQ Med | eQQ Mean | eQQ Max | ||||
| Distance | 99.9961 | 99.998 | 99.9881 | 99.5987 | |||
| Age in years | 65.9777 | 100 | 12.6642 | –33.3333 | |||
| CDS | 76.1569 | 96.5161 | 75.8857 | –280.3137 | |||
| Ded_high | –73.2294 | 0 | –75 | 0 | |||
| Geneva | 98.5928 | 0 | 98.5938 | 0 | |||
| Mittelland | 89.1814 | 0 | 89.1892 | 0 | |||
| Northwest | 95.9416 | 0 | 95.9391 | 0 | |||
| East | 97.4541 | 0 | 97.4545 | 0 | |||
| Ticino | 100 | 0 | 100 | 100 | |||
| Central | 97.8136 | 0 | 97.8166 | 0 | |||
| Zurich | 11.2542 | 0 | 12 | 0 | |||
| No. of hospitalised days | 73.6366 | 0 | 71.5987 | 86.7725 | |||
Table A5
Results showing the effectiveness of the propensity score matching among patients with cardiovascular diseases.
| Summary of balance for all data | |||||||
| Means Treated | Means Control | SD Control | Mean Diff | eQQ Med | eQQ Mean | eQQ Max | |
| Distance | 0.2337 | 0.182 | 0.0916 | 0.0517 | 0.0463 | 0.0517 | 0.1126 |
| Age in years | 67.9767 | 68.2904 | 13.7438 | –0.3137 | 1 | 0.5933 | 3 |
| CDS | 5121.7543 | 5853.2708 | 5314.8696 | –731.5165 | 723 | 731.95 | 8342 |
| Ded_high | 0.1071 | 0.0879 | 0.2831 | 0.0192 | 0 | 0.0192 | 1 |
| Geneva | 0.0506 | 0.1467 | 0.3538 | –0.0961 | 0 | 0.0961 | 1 |
| Mittelland | 0.2045 | 0.189 | 0.3915 | 0.0155 | 0 | 0.0155 | 1 |
| Northwest | 0.2474 | 0.1372 | 0.3441 | 0.1102 | 0 | 0.1102 | 1 |
| East | 0.2091 | 0.128 | 0.3341 | 0.0812 | 0 | 0.0812 | 1 |
| Ticino | 0.0009 | 0.0816 | 0.2737 | –0.0806 | 0 | 0.0806 | 1 |
| Central | 0.0382 | 0.0792 | 0.2701 | –0.041 | 0 | 0.041 | 1 |
| Zurich | 0.2492 | 0.2384 | 0.4261 | 0.0109 | 0 | 0.0109 | 1 |
| No. of hospitalised days | 2.5988 | 3.4439 | 13.2891 | –0.8451 | 0 | 0.8484 | 126 |
| Summary of balance for matched data | |||||||
| Means Treated | Means Control | SD Control | Mean Diff | eQQ Med | eQQ Mean | eQQ Max | |
| Distance | 0.2337 | 0.2337 | 0.0662 | 0 | 0 | 0 | 0.0003 |
| Age in years | 67.9767 | 67.8084 | 13.5411 | 0.1683 | 0 | 0.4208 | 2 |
| CDS | 5121.7543 | 4974.4921 | 4685.194 | 147.2622 | 37 | 147.2622 | 9616 |
| Ded_high | 0.1071 | 0.104 | 0.3052 | 0.0031 | 0 | 0.0031 | 1 |
| Geneva | 0.0506 | 0.0516 | 0.2212 | –0.001 | 0 | 0.001 | 1 |
| Mittelland | 0.2045 | 0.2063 | 0.4047 | –0.0018 | 0 | 0.0018 | 1 |
| Northwest | 0.2474 | 0.2422 | 0.4284 | 0.0053 | 0 | 0.0053 | 1 |
| East | 0.2091 | 0.2083 | 0.4061 | 0.0008 | 0 | 0.0008 | 1 |
| Ticino | 0.0009 | 0.0009 | 0.0303 | 0 | 0 | 0 | 0 |
| Central | 0.0382 | 0.0378 | 0.1907 | 0.0004 | 0 | 0.0004 | 1 |
| Zurich | 0.2492 | 0.2529 | 0.4347 | –0.0037 | 0 | 0.0037 | 1 |
| No. of hospitalised days | 2.5988 | 2.2298 | 8.943 | 0.369 | 0 | 0.369 | 92 |
| Percent Balance Improvement | |||||||
| Mean Diff. | eQQ Med | eQQ Mean | eQQ Max | ||||
| Distance | 99.999 | 100 | 99.9974 | 99.7426 | |||
| Age in years | 46.348 | 100 | 29.0753 | 33.3333 | |||
| CDS | 79.8689 | 94.8824 | 79.8808 | –15.2721 | |||
| Ded_high | 83.6103 | 0 | 83.5994 | 0 | |||
| Geneva | 98.9564 | 0 | 98.9565 | 0 | |||
| Mittelland | 88.3166 | 0 | 88.3094 | 0 | |||
| Northwest | 95.2223 | 0 | 95.2224 | 0 | |||
| East | 98.9701 | 0 | 98.9701 | 0 | |||
| Ticino | 100 | 0 | 100 | 100 | |||
| Central | 99.1171 | 0 | 99.1174 | 0 | |||
| Zurich | 66.4629 | 0 | 66.4962 | 0 | |||
| No. of hospitalised days | 56.3321 | 0 | 56.5015 | 26.9841 | |||
Table A6
Results showing the effectiveness of the propensity score matching among patients with respiratory illnesses.
| Summary of balance for all data | |||||||
| Means Treated | Means Control | SD Control | Mean Diff | eQQ Med | eQQ Mean | eQQ Max | |
| Distance | 0.225 | 0.1852 | 0.0811 | 0.0398 | 0.0311 | 0.0398 | 0.1281 |
| Age in years | 57.0702 | 59.2733 | 17.9302 | –2.2031 | 1 | 2.2023 | 6 |
| CDS | 5843.5821 | 7056.6819 | 6215.7646 | –1213.0998 | 1274 | 1214.3879 | 5390 |
| Ded_high | 0.1458 | 0.1004 | 0.3005 | 0.0455 | 0 | 0.0455 | 1 |
| Geneva | 0.1088 | 0.1707 | 0.3763 | –0.0619 | 0 | 0.0619 | 1 |
| Mittelland | 0.2145 | 0.1836 | 0.3872 | 0.0309 | 0 | 0.0309 | 1 |
| Northwest | 0.2277 | 0.1386 | 0.3455 | 0.0891 | 0 | 0.089 | 1 |
| East | 0.1648 | 0.1162 | 0.3204 | 0.0487 | 0 | 0.0487 | 1 |
| Ticino | 0.0015 | 0.0783 | 0.2686 | –0.0768 | 0 | 0.0768 | 1 |
| Central | 0.0405 | 0.0737 | 0.2612 | –0.0332 | 0 | 0.0333 | 1 |
| Zurich | 0.2422 | 0.2389 | 0.4264 | 0.0033 | 0 | 0.0032 | 1 |
| No. of hospitalised days | 2.2707 | 3.6888 | 13.9077 | –1.4181 | 0 | 1.427 | 86 |
| Summary of balance for matched data | |||||||
| Means Treated | Means Control | SD Control | Mean Diff | eQQ Med | eQQ Mean | eQQ Max | |
| Distance | 0.225 | 0.225 | 0.0616 | 0 | 0 | 0 | 1.80E-03 |
| Age in years | 57.0702 | 56.3366 | 18.3466 | 0.7336 | 1 | 0.9846 | 4.00E+00 |
| CDS | 5843.5821 | 5560.6678 | 5161.4738 | 282.9143 | 118 | 282.9143 | 1.46E+04 |
| Ded_high | 0.1458 | 0.1423 | 0.3494 | 0.0035 | 0 | 0.0035 | 1.00E+00 |
| Geneva | 0.1088 | 0.1182 | 0.3228 | –0.0094 | 0 | 0.0094 | 1.00E+00 |
| Mittelland | 0.2145 | 0.2161 | 0.4116 | –0.0016 | 0 | 0.0016 | 1.00E+00 |
| Northwest | 0.2277 | 0.2203 | 0.4144 | 0.0074 | 0 | 0.0074 | 1.00E+00 |
| East | 0.1648 | 0.1561 | 0.363 | 0.0087 | 0 | 0.0087 | 1.00E+00 |
| Ticino | 0.0015 | 0.0015 | 0.0385 | 0 | 0 | 0 | 0.00E+00 |
| Central | 0.0405 | 0.0385 | 0.1925 | 0.0019 | 0 | 0.0019 | 1.00E+00 |
| Zurich | 0.2422 | 0.2493 | 0.4326 | –0.0071 | 0 | 0.0071 | 1.00E+00 |
| No. of hospitalised days | 2.2707 | 2.0296 | 8.3597 | 0.2411 | 0 | 0.2525 | 6.50E+01 |
| Percent Balance Improvement | |||||||
| Mean Diff. | eQQ Med | eQQ Mean | eQQ Max | ||||
| Distance | 99.9864 | 99.9948 | 99.9755 | 98.6262 | |||
| Age in years | 66.7028 | 0 | 55.2938 | 33.3333 | |||
| CDS | 76.6784 | 90.7378 | 76.7031 | –171.4286 | |||
| Ded_high | 92.2086 | 0 | 92.2111 | 0 | |||
| Geneva | 84.8611 | 0 | 84.8708 | 0 | |||
| Mittelland | 94.8211 | 0 | 94.8148 | 0 | |||
| Northwest | 91.6597 | 0 | 91.656 | 0 | |||
| East | 82.1497 | 0 | 82.1596 | 0 | |||
| Ticino | 100 | 0 | 100 | 100 | |||
| Central | 94.1467 | 0 | 94.1581 | 0 | |||
| Zurich | –117.8243 | 0 | –121.4286 | 0 | |||
| No. of hospitalised days | 83.0015 | 0 | 82.3068 | 24.4186 | |||
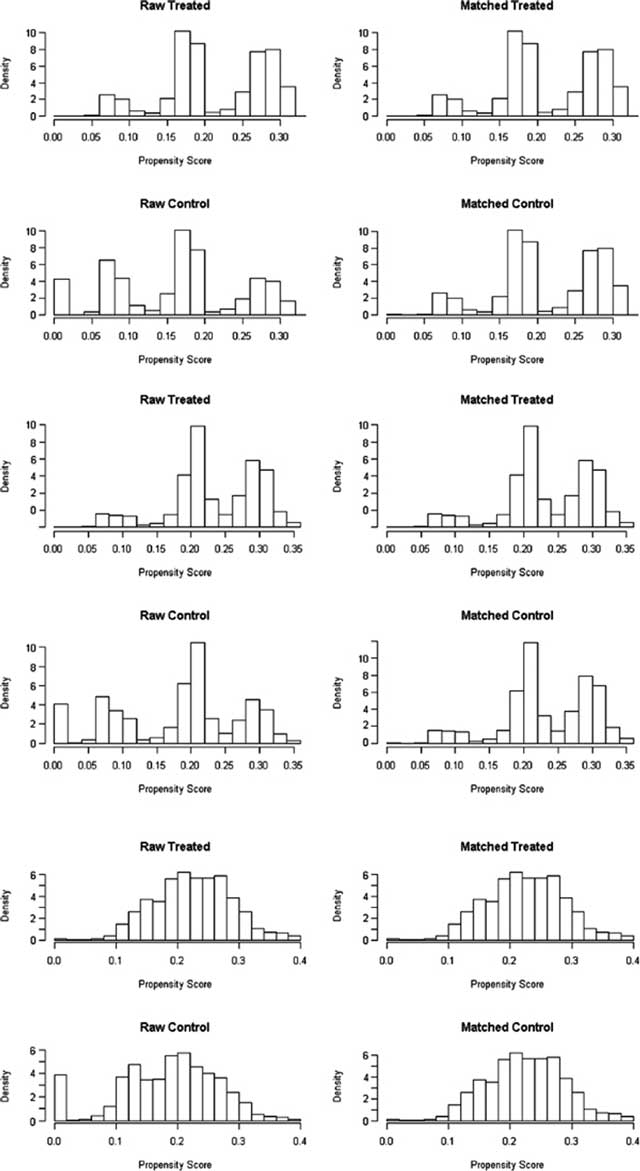
Figure A1
Propensity score before and after matching in patients with diabetes, cardiovascular diseases and respiratory illnesses.
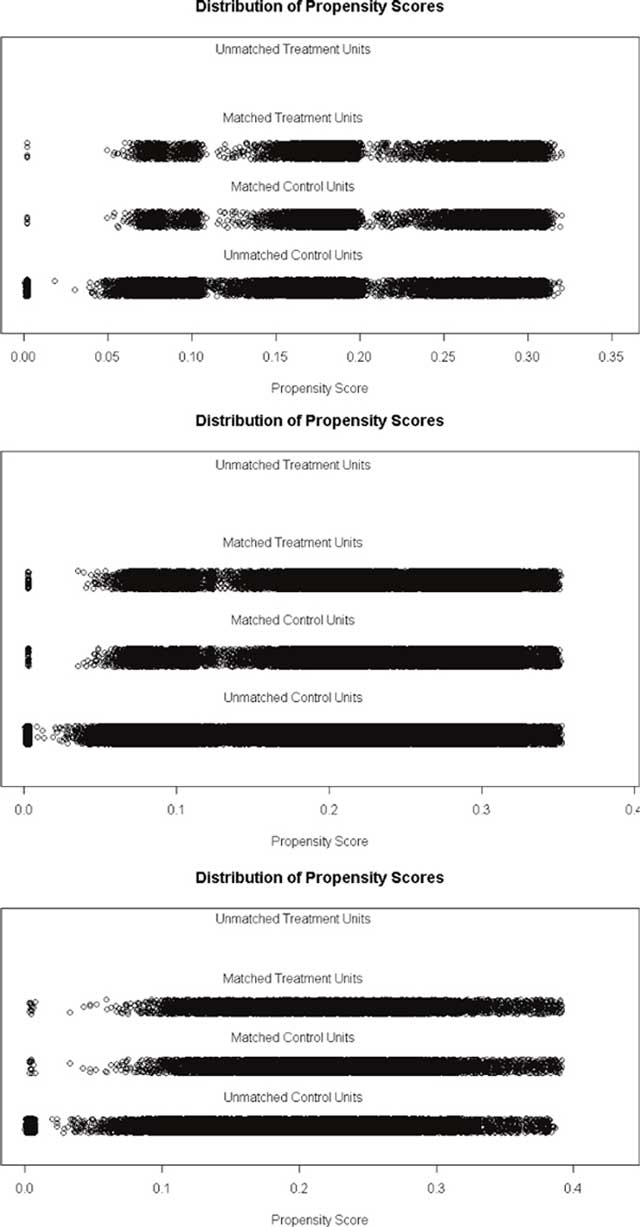
Figure A2
Distribution of propensity score in patients with diabetes, cardiovascular diseases and respiratory illnesses.