
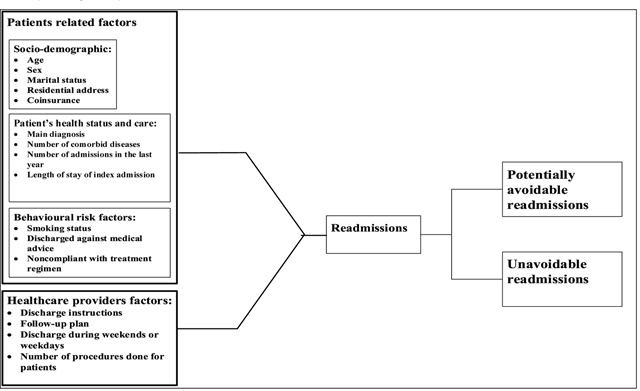
Figure 1
Conceptual Framework.
Table 1
Multiple linear regression results for all readmissions and avoidable readmissions.
| All Readmissions | Avoidable Readmissions | |||
|---|---|---|---|---|
| Estimate | Significance | Estimate | Significance | |
| (Intercept) | 2.805 | 0.029 | 2.443 | 0.277 |
| Age | –0.045 | 0.027 | –0.045 | 0.016 |
| Gender=Male | –0.212 | 0.516 | –1.444 | 0.104 |
| Marital Status=Single | 0.859 | 0.173 | 2.494 | 0.117 |
| Insurance Status= ≥20% | –0.067 | 0.154 | 0.853 | 0.181 |
| Distance in Km=’> 60’ | 5.630 | 0.202 | 6.314 | 0.151 |
| Distance in Km=’15–29’ | –0.726 | 0.419 | –1.986 | 0.140 |
| Distance in Km=’30–44’ | 0.030 | 0.965 | –0.392 | 0.739 |
| Distance in Km=’45–59’ | 0.755 | 0.221 | 1.612 | 0.238 |
| Number of Comorbidities | –0.029 | 0.806 | 0.032 | 0.553 |
| Number of Admissions in the Last Year | 0.073 | 0.037 | 0.105 | 0.005 |
| Smoking Status=Smoker | 0.948 | 0.157 | 0.609 | 0.574 |
| Discharged Against Medical Advice=No | 0.411 | 0.477 | 0.378 | 0.625 |
| Compliant with Treatment=Not Compliant | –0.325 | 0.629 | –0.734 | 0.387 |
| Discharge Instructions= Incomplete | 0.514 | 0.252 | 1.600 | 0.072 |
| Follow-Up-Plan=Unclear | 0.216 | 0.828 | 0.011 | 0.996 |
| Discharge during Weekends or Weekdays=Weekends | –0.152 | 0.765 | –0.449 | 0.658 |
| Number Of Procedures | 0.749 | 0.000 | 0.721 | 0.000 |
| Delay (Time between Discharge and Readmission) | 0.007 | 0.722 | –0.006 | 0.853 |
Table 2
All admission and readmission factors with significant t-test results.
| 1- All Admissions N=3962 | T-Statistic Values (–/+) and Significance Level (*/**) | |||||
| H0 : μ1–μ2= 0 Regarding groups of | LOS | Age | Delay | Admissions-Year back | # Procedures | # Comorbidity |
| Gender (Male – Female) | –1.770 | 0.763 | –0.997 | –0.715 | 1.016 | – 0.531 |
| Smoking (Non – Yes) | 1.300 | –4.089** | 0.034 | –8.626** | 0.307 | –11.258** |
| Compliant with treatment (No – Yes) | 1.331 | 0.871 | –0.347 | –1.393 | 1.760 | 0.066 |
| Marital Status (Single – Married) | 1.281 | –43.564** | 0.241 | 0.428 | –4.247** | –18.468** |
| Discharge (Weekend – Weekday) | 0.480 | –2.529* | 1.632 | –0.465 | – 0.040 | – 0.930 |
| Coinsurance (<20% – >20%) | 2.449 | –9.360** | –0.113 | 15.699** | –1.733 | 0.016 |
| Discharge Decision (Not AMA – Against Medical) | –0.199 | –0.842 | 0.315 | –1.141 | –1.821 | –2.645 |
| Follow-up plan (Unclear – Clear) | 1.200 | 2.685 | –0.993 | 1.063 | 1.407 | 3.176* |
| Discharge Instructions (Unclear – Clear) | 0.600 | 0.664 | –1.225 | 1.388 | –0.138 | 0.625 |
| 2- Readmissions N=1157 | T-Statistic Values (–/+) and Significance Level (*/**) | |||||
| H0 : μ1–μ2= 0 Regarding groups of | LOS | Age | Delay | Admissions-Year back | # Procedures | # Comorbidity |
| Gender (Male – Female) | –1.140 | 1.250 | –0.997 | –1.514 | –0.023 | –2.175* |
| Smoking (Non – Yes) | 0.157 | –3.798** | 0.034 | –4.394** | –0.045 | –5.611** |
| Compliant with Treatment (No – Yes) | 1.224 | 1.125 | –0.866 | –0.908 | 2.550* | –0.211 |
| Marital Status (Single – Married) | 1.921 | –24.721** | 0.241 | 0.034 | –1.006 | –11.279** |
| Discharge (Weekend – Weekday) | –0.216 | –2.307 | 1.632 | 0.579 | –0.381 | 0.779 |
| Coinsurance (<20%–>20%) | 1.264 | –7.166** | –0.113 | 7.695** | –2.862** | –1.306 |
| Discharge Decision (Not AMA – Against Medical) | –1.148 | –1.251 | 0.315 | 1.064 | –2.890* | –1.361 |
| Follow-up plan (Clear –Unclear) | 0.758 | 1.259 | –0.993 | –2.083* | 0.912 | 0.589 |
| Discharge Instructions (Clear – Unclear) | 1.454 | 0.807 | –1.225 | –1.614 | 1.313 | – 0.252 |
[i] (*): Significant at 0.05, (**): Significant at 0.001.
Table 3
Avoidable readmission factors with significant t-test results.
| Avoidable readmissions N=506 | T-Statistic Values (–/+) and Significance Level (*/**) | |||||
|---|---|---|---|---|---|---|
| H0 : μ1–μ2= 0 Regarding groups of | LOS | Age | Delay | Admissions-Year back | # Procedures | # Comorbidity |
| Gender (Male – Female) | –2.420* | –0.466 | –0.927 | 1.463 | –1.094 | –0.999 |
| Smoking (Non – Yes) | 0.113 | –1.259 | 0.557 | –1.845 | 0.603 | –2.544* |
| Compliant with Treatment (No – Yes) | 0.388 | –0.358 | –0.778 | –0.139 | 1.339 | –1.738 |
| Marital Status (Single – Married) | 2.461* | –17.935** | 0.141 | 2.298 * | –0.705 | –8.047** |
| Discharge (Weekend – Other) | –0.212 | –2.779 | 1.446 | 0.606 | –0.232 | –0.585 |
| Coinsurance (<20%–>20%) | 1.256 | –5.146** | –0.929 | 4.900** | –0.978 | –0.640 |
| Discharge Decision (Not AMA – Against Medical) | –0.781 | 0.286 | 0.183 | –0.568 | –1.899 | – 0.228 |
| Follow-up plan (Clear – Unclear) | –0.836 | 0.633 | –0.238 | –1.379 | – 0.795 | –1.125 |
| Discharge Instructions (Clear – Unclear) | 0.525 | –1.247 | –0.377 | –1.383 | –0.972 | –3.640** |
[i] (*): Significant at 0.05, (**): Significant at 0.001.
Table 4
JRip data mining rules for avoidable readmissions.
| Rules for all readmission (readmissions vs. no readmissions) ROC area= 0.71 and Accuracy > 75% | Predicted class | Accuracy |
| Rule 1: (MAIN_DISEASE_CAT = ICD-10 CAT 2) and (ADMISIONS_AYEAR_BACK >= 5) | Readmission | 74% |
| Rule 2: (MAIN_DISEASE_CAT = ICD-10 CAT 2) | Readmission | 69% |
| Rule 3: (ADMISIONS_AYEAR_BACK >= 2, (DISCHARGE_INSTRUCTIONS = no evidence of clear), and (AGE <= 65) | Readmission | 73% |
| Rule 4: (ADMISIONS_AYEAR_BACK >= 3) and (DISCHARGE_DECISION = against medical advice) | Readmission | 77% |
| Rule 5: (COINSURANCE = <20), (FOLLOW_UP_PLAN = no evidence of clear), (MED_COMPLIANT = not compliant with treatment), and (ADMISIONS_AYEAR_BACK >= 1) | Readmission | 94% |
| Rule 6: (ADMISIONS_AYEAR_BACK >= 2), (DISCHARGE_INSTRUCTIONS = no evidence of clear), (NUMBER_OF_PROCEDURES <= 1), (NUM_COMORBIDITY <= 3), and (AGE >= 33) | Readmission | 82% |
| Rules of potentially avoidable readmissions (avoidable vs. unavoidable) | Predicted class | Accuracy |
| Rule 1: (AGE >= 61), (FOLLOW_UP_PLAN = no evidence of clear), and (MAIN_DISEASE_CAT = ICD-10 CAT 10) | Avoidable | 83% |
| Rule 2: (AGE >= 61) and (DISCHARGE_DECISION = against medical advice) | Avoidable | 89% |
| Rule 3: (MED_COMPLIANT = not compliant) | Avoidable | 100% |
| Rule 4: (FOLLOW_UP_PLAN = no evidence of clear), (AGE >= 56), (NUMBER_OF_PROCEDURES >= 9) and (NUMBER_OF_PROCEDURES <= 14) | Avoidable | 84% |
| Rule 5: (FOLLOW_UP_PLAN = no evidence of clear), (AGE >= 61), (NUMBER_OF_PROCEDURES <= 4), (DELAY <= 10), and (LOS >= 3) | Avoidable | 84% |
| Rule 6: (DISCHARGE_INSTRUCTIONS = no evidence of clear), (DELAY > 12), (DELAY < 16), and (NUM_COMORBIDITY >= 3) | Avoidable | 75% |
| Rule 7: (FOLLOW_UP_PLAN = no evidence of clear), (SMOKING STATUS = smoker), and (ADMISIONS_AYEAR_BACK <= 3) | Avoidable | 79% |
| Rule 8: (DISCHARGE_DECISION = against medical advice) | Avoidable | 86% |
| Rule 9: (FOLLOW_UP_PLAN = no evidence of clear), (MAIN_DISEASE_CAT = ICD-10 CAT 5), and (AGE <= 57) | Avoidable | 79% |
[i] Abbreviations:
ICD-10 CAT 2: Malignant Neoplasms.
ICD-10 CAT 5: Endocrine, nutritional and metabolic diseases.
ICD-10 CAT 10: Diseases of the circulatory system.
Table 5
Logistic regression model of factors influencing all readmissions & avoidable readmissions.
| All Readmissions | Avoidable Readmission | ||||
|---|---|---|---|---|---|
| Factor | Levels | Adjusted Odd’s Ratio | 95% Confidence Interval | Adjusted Odd’s Ratio | 95% Confidence Interval |
| Gender | Female Male | 0.971 | 0.847–1.114 | 0.879 | 0.729–1.061 |
| Smoking | Yes No | 2.318 | 1.953–.751* | 1.816 | 1.393–2.367* |
| Compliant | Yes No | 0.054 | 0.0270.109* | 0.760 | 0.470–1.230 |
| Marital status | Married Single | 0.981 | 0.815–1.181 | 0.963 | 0.749–1.238 |
| Discharge | Weekday Weekend | 1.037 | 0.827–1.300 | 1.317 | 0.943–1.838 |
| Coinsurance | ≥20% <20% | 0.393 | 0.032–.047* | 1.617 | 1.145–2.282* |
| Discharge Decision | Not AMA AMA | 0.247 | 0.1750.349* | 0.106 | 0.057–0.197* |
| Follow-up plan | Clear Unclear | 0.662 | 0.565–0.776* | 0.338 | 0.249–0.460* |
| Discharge Instruction | Clear Unclear | 0.633 | 0.565–0.779* | 0.337 | 0.277–0.512* |
| Age | 1.096 | 0.994–1.111* | 1.019 | 1.012–1.025* | |
| LOS | 1.166 | 1.143–1.189* | 1.027 | 1.008–1.046* | |
| Delay | NA | – | 0.998 | 0.982–1.013 | |
| Adm. Year Back | 1.022 | 1.010–1.034* | 0.963 | 0.939–0.989* | |
| Number of procedures | 0.992 | 0.981–1.003 | 1.043 | 1.021–1.065* | |
| Number of co morbidity | 1.109 | 1.069–1.150* | 1.196 | 1.124–1.272* | |
[i] (*): Significant at 0.05.
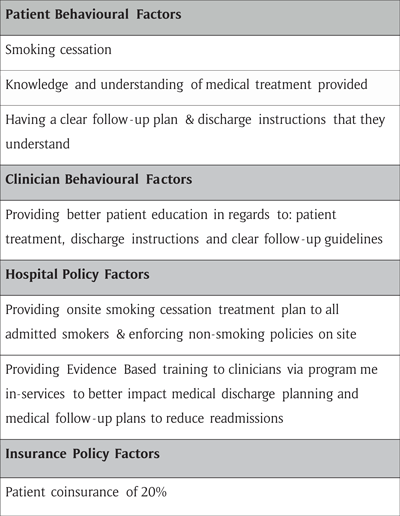
Figure 2
Heuristic guide impacting hospital readmissions.