
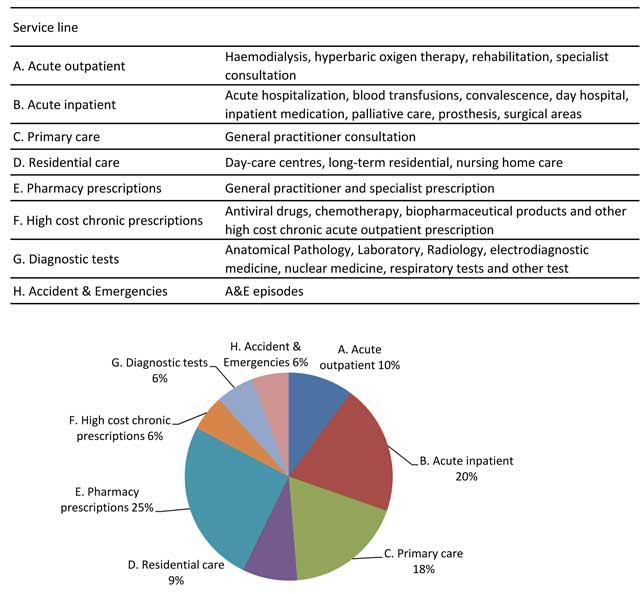
Figure 1
SSIBE healthcare services.
Table 1
Percent of population by morbidity burden.
| Health Status | 0 | 1 | 2 | 3 | 4 | 5 | 6 | Total |
|---|---|---|---|---|---|---|---|---|
| 1. Healthy | 32.65% | 16.95% | 0.26% | 0.31% | 1.50% | 51.69%* | ||
| 2. History Of Significant Acute Disease | 4.65% | 0.54% | 0.16% | 1.31% | 6.66%** | |||
| 3. Single Minor Chronic Disease | – | 6.67% | 2.10% | 8.77% | ||||
| 4. Minor Chronic Disease In Multiple Organ Systems | – | 1.07% | 0.17% | 1.01% | 0.48% | 2.73% | ||
| 5. Single Dominant Or Moderate Chronic Disease | – | 9.16% | 2.79% | 0.75% | 0.05% | 0.09% | 0.01% | 12.85% |
| 6. Significant Chronic Disease In Multiple Organ Systems | – | 6.75% | 3.12% | 2.52% | 1.73% | 0.64% | 0.09% | 14.86% |
| 7. Dominant Chronic Disease In Three Or More Organ Systems | – | 0.29% | 0.26% | 0.60% | 0.16% | 0.12% | 0.03% | 1.47% |
| 8. Dominant, Metastatic, And Complicated Malignancies | – | 0.06% | 0.19% | 0.23% | 0.15% | 0.03% | 0.66% | |
| 9. Catastrophic Conditions | – | 0.02% | 0.10% | 0.06% | 0.06% | 0.03% | 0.05% | 0.32% |
[i] Cross-sectional data at 31/12/2012. N = 92,498 individuals.
Clinical Risk Groups classification system. ACRG3: Health Status & severity level.
* Healthy
1.0 Healthy
1.1 Healthy Non-User
1.2 Delivery without Other Significant Illness
1.4 Pregnancy without Delivery without Other Significant Illness
1.5 Evidence of Significant Chronic or Acute Diagnosis without Other Significant Illness
** History Of Significant Acute Disease
2.0 History Of Significant Acute Disease
2.2 Delivery with History of Significant Acute Illness
2.4 Pregnancy without Delivery with History of Significant Acute Illness
2.5 Evidence of Significant Chronic or Acute Diagnosis with History of Significant Acute Illness

Figure 2
Manning – Mullahy Algorithm.
Table 2
Algorithm results: Model choice for individuals with positive costs.
| Service line | N | kurtosis | Model | Park | Distribution | Hosmer-Lemeshow (p-value) | MAPE/100 | MEDAPE/100 | Pregibon link (p-value) | Breusch Pagan (p-value) |
|---|---|---|---|---|---|---|---|---|---|---|
| 1. Acute Outpatient | 33,949 | 3.06 | GLM | 2.21 | Gamma | 0.09 (0.999) | 1.43 | 0.68 | –0.001 (0.926) | – |
| 2. Acute inpatient | 7,403 | 2.7S | GLM | 2.17 | Gamma | 0.15 (0.999) | 4.70 | 0.75 | –0.002 (0.980) | – |
| 3. Primary care | 72,514 | 2.91 | GLM | 1.79 | Gamma | 56.33 (<0.001) | 1.07 | 0.51 | –0.117 (<0.001) | – |
| 4. Pharmacy prescriptions | 61,682 | 3.35 | Log-ols | – | – | 23.39 (<0.001) | 0.39 | 0.19 | – | 1,949.39 (<0.001) |
| 5. High cost chronic prescriptions | 947 | 2.31 | GLM | 1.00 | Poisson | 1.29 (0.233) | 20.20 | 1.03 | 0.005 (0.855) | – |
| 6. Diagnostic tests | 42,273 | 2.69 | GLM | 2.08 | Gamma | 2.22 (0.014) | 1.66 | 0.76 | –0.022 (0.162) | – |
| 7. Accident & Emergencies | 19,949 | 3.07 | GLM | 1.94 | Gamma | 1.02 (0.422) | 2.02 | 0.73 | –0.012 (0.526) | – |
| 8. Total healthcare cost | 76,360 | 3.40 | Log-ols | – | – | 46.12 (<0.001) | 0.14 | 0.10 | – | 1,227.20 (<0.001) |
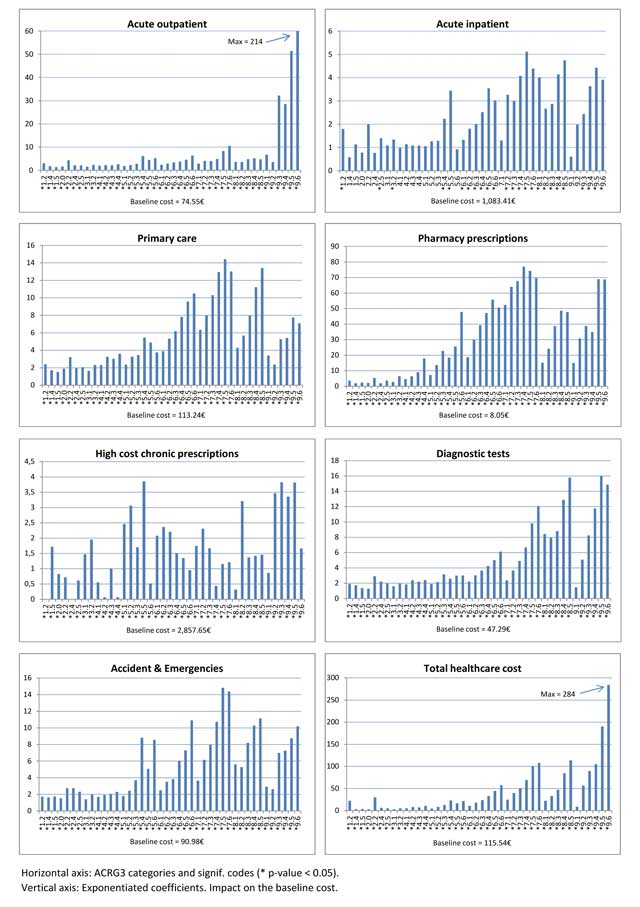
Figure 3
Impact of morbidity on resource consumption.
Table 3
Impact of Age and sex in resource consumption.
| Service line | Age | Sex (male) |
|---|---|---|
| 1. Acute Outpatient | 1.0012* | 0.9786 |
| 2. Acute Inpatient | 1.0014 | 0.9641 |
| 3. Primary care | 0.9912* | 0.8925* |
| 4. Pharmacy prescriptions | 1.0126* | 0.8503* |
| 5. High cost chronic prescriptions | 0.9881* | 1.2182* |
| 6. Diagnostic tests | 0.9993 | 0.8655* |
| 7. Accident & Emergencies | 0.9973* | 0.9952 |
| 8. Total healthcare cost | 0.9952* | 0.8661* |
[i] * p-value < 0.05.