
Table 1
Agreed items of collaboration before and after IHO reform.
| T = 0 | T = 1 | |
|---|---|---|
| Referral System | 20 | 24 |
| Extended Specialty | 10 | 12 |
| Clinical Training | 26 | 30 |
| Technical Assistance | 30 | 20 |
| Mutual Recognition | 30 | 21 |
| Telemedicine | 0 | 10 (6 suspended) |
| Further Education | 19 | 25 |
| Lectures | 21 | 11 |
| Academic Program | 0 | 0 |
Table 2
Fulfilled factors of collaboration before and after IHO reform.
| T = 0 | T = 1 | |
|---|---|---|
| Culture | 0 | 0 |
| Leadership | 0 | 2 |
| Incentive Mechanism | 0 | 2 |
| Organized Team | 0 | 4 |
| Ability Training | 20 | 15 |
| Shared Techniques | 6 | 4 |
| Behavior Specification | 0 | 4 |
| Shared Information | 0 | 3 |
| Communication Tool | 0 | 2 |
| Stakeholder Negotiation | 0 | 2 |
Table 3
Staff communication frequency (per month) before and after IHO reform.
| Community → County | County → Community | |||||||
|---|---|---|---|---|---|---|---|---|
| T = 0 | T = 1 | T = 0 | T = 1 | |||||
| n | % | n | % | n | % | n | % | |
| 0 | 19 | 14.7 | 25 | 19.4 | 69 | 33.5 | 68 | 32.4 |
| 1 | 50 | 38.8 | 63 | 48.9 | 68 | 33.0 | 56 | 26.7 |
| 2 | 24 | 18.6 | 25 | 19.4 | 35 | 17.0 | 35 | 16.7 |
| 3 | 17 | 13.2 | 10 | 7.8 | 15 | 7.3 | 21 | 10.00 |
| 4 or above | 19 | 14.7 | 6 | 4.7 | 19 | 9.2 | 30 | 14.3 |
| χ2 = 10.91, P = 0.0218 | χ2 = 4.60, P = 0.331 | |||||||
Table 4
Staff communication content before and after IHO reform.
| Community → County | County → Community | |||
|---|---|---|---|---|
| T = 0 | T = 1 | T = 0 | T = 1 | |
| diagnosis | 8 | 16 | 36 | 36 |
| Exam result | 38 | 48 | 72 | 69 |
| Test result | 39 | 50 | 73 | 72 |
| Treatment | 42 | 55 | 33 | 35 |
| Medication | 2 | 10 | 1 | 3 |
| χ2 = 21.08, P = 0.001 | χ2 = 1.13, P = 0.890 | |||
Table 5
Mutual trust between community and hospital staff.
| Community → County | County → Community | |||
|---|---|---|---|---|
| n | % | n | % | |
| No doubt | 1 | 0.8 | 3 | 1.4 |
| Trust | 17 | 13.2 | 21 | 9.8 |
| Conservative trust | 88 | 68.2 | 124 | 57.7 |
| No trust | 19 | 14.7 | 37 | 17.2 |
| Serious doubt | 4 | 3.1 | 30 | 14.0 |
Table 6
Reasons for low mutual trust between community and hospital staff.
| Community staff | Hospital staff | |||
|---|---|---|---|---|
| n | % | n | % | |
| Lack of sustainable cooperation mechanisms | 202 | 58.7 | 101 | 78.3 |
| Frozen practice position | 144 | 41.9 | 40 | 31.0 |
| Lack of financial incentives | 233 | 67.7 | 97 | 75.2 |
| Inconsistency of practice | 106 | 30.8 | 36 | 27.9 |
| Lack of continuous communication mechanisms | 108 | 31.4 | 74 | 57.4 |
| Lack of convenient communication tools | 134 | 39.0 | 103 | 79.8 |
| Lack of steady technical exchange | 202 | 58.7 | 101 | 78.3 |
| Other reasons | 9 | 2.6 | 0 | 0 |
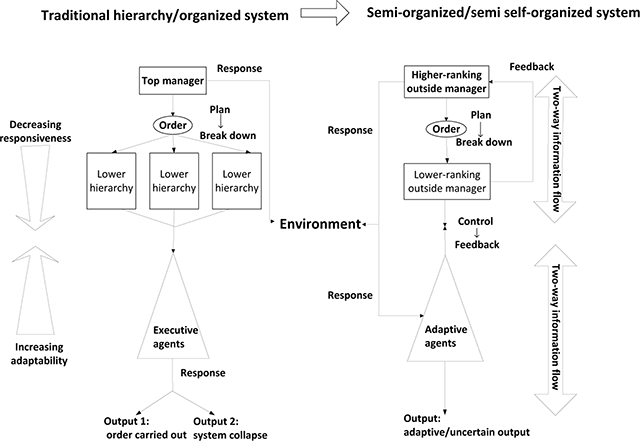
Figure 1
Traditional organised system and self-organised system approaches. Analysis flowchart of policy implementation following the semi-organised system approach.
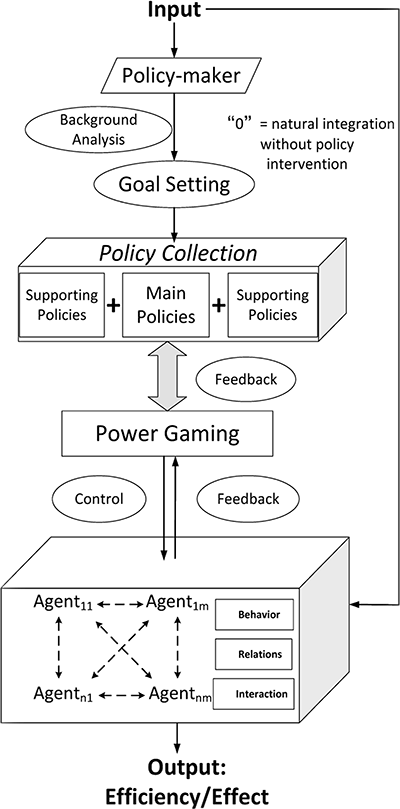
Figure 2
Model of policy implementation flow.
Table 7
Characteristics of key persons interviewed.
| Identity | Professional Years | Opinions | ||
|---|---|---|---|---|
| System-view | Implement-view | |||
| I | Health Administrator | 21 | Organized | Top-down |
| II | Health Administrator | 15 | Semi-organized | Mixed |
| III | Insurance Administrator | 18 | Self-organized | Mixed |
| IV | Insurance Administrator | 8 | Self-organized | Mixed |
| V | County hospital director | 12 | Semi-organized | Mixed |
| VI | County hospital professionals | 14 | Semi-organized | Bottom-up |
| VII | County hospital professionals | 5 | Self-organized | Mixed |
| VIII | Township hospital manager | 10 | Organized | Top-down |
| IX | Township hospital clinician | 9 | Self-organized | Bottom-up |
| X | Primary doctor | 8 | Semi-organized | Mixed |
| XI | Primary doctor | 15 | Organized | Mixed |
| XII | Village doctor | 11 | Self-organized | Mixed |