
Table 1
Prospective study: satisfaction with aspects of treatment and care.
| Hospital | Intermediate ward | Hospital | |
|---|---|---|---|
| Professional competence | 79 % | 86 % | 93 % |
| Concern for the patients | 73 % | 90 % | 100 % |
| Information on treatment | 58 % | 64 % | 73 % |
| Involvement of patients | 29 % | 53 % | 47 % |
| Organisation of care | 55 % | 81 % | 77 % |
| Medical equipment | 74 % | 79 % | 60 % |
| Peaceful environment | 60 % | 79 % | 70 % |
| Personnel-patient time | 58 % | 84 % | 87 % |
| Food and meals | 58 % | 76 % | 70 % |
| Reception of relatives | 71 % | 82 % | 83 % |
| Information on discharge | 68 % | 80 % | 77 % |
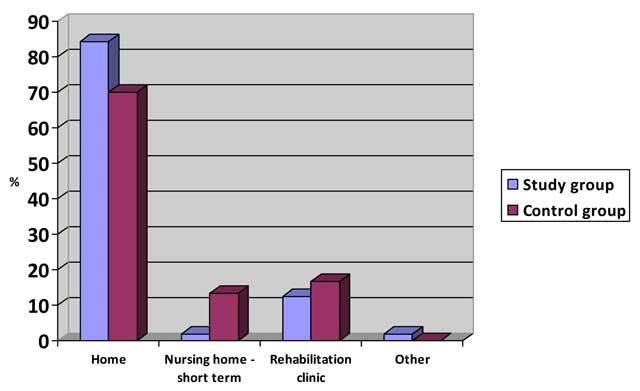
Figure 1
Where the patients were discharged to.
Table 2
Average costs (NOK) of patients at the intermediate ward and the hospital departments.
| Units | Bed occupancy | 2009 | 2010 | 2011 |
|---|---|---|---|---|
| Department of general surgery | 100 % | 4.044 | 4.240 | 4.157 |
| Department of orthopaedic surgery | 100 % | 4.501 | 4.742 | 4.841 |
| Department of internal medicine | 100 % | 5.360 | 5.921 | 6.137 |
| Intermediate ward | 70 % | 4.088 | 4.282 | 3.809 |
| Intermediate ward | 100 % | 2.862 | 2.998 | 2.667 |