
Table 1
Basic information of Huangzhong and Hualong (2013).
| Indicators | Huangzhong County | Hualong County |
|---|---|---|
| Population (thousands) | 480.6 | 276.6 |
| GDP per capita (RMB) | 31484 | 16537.7 |
| Income per capita (RMB) | 8064 | 5854 |
| Average life expectancy at birth (years) | 71.3 | 70 |
| No. of hospital beds (per thousand population) | 2.34 | 2.40 |
| No. of practitioners/assistant practitioners (per thousand population) | 0.96 | 0.96 |
| No. of staff in professional public health institutions (per thousand population) | 0.21 | 0.21 |
| No. of outpatient admission (thousand) | 270. 0 | 266.1 |
| No. of inpatient admission (thousand) | 29.0 | 24.9 |
| % population enrolled in NCMS* | 99.68 | 99.87 |
| “Equalization of basic public health services” Project** | From 2009 | From 2009 |
| Reform of compensation mechanism in county hospital | Form June, 2012 | From April, 2014 |
| Zero-markup of drug | From September, 2010 | From January, 2011 |
[i] * NCMS is short for New Cooperative Medical Insurance System, the insurance for residence in rural China.
** “Equalization of basic public health services” is a project, which delivers 13 preventive health services for all people in order to reduce health disparities.
Table 2
Number of interviewees in each county.
| Huangzhong | Hualong | |
|---|---|---|
| Institution leaders | 15 | 14 |
| Doctors | 39 | 27 |
| Patients | 28 | 16 |
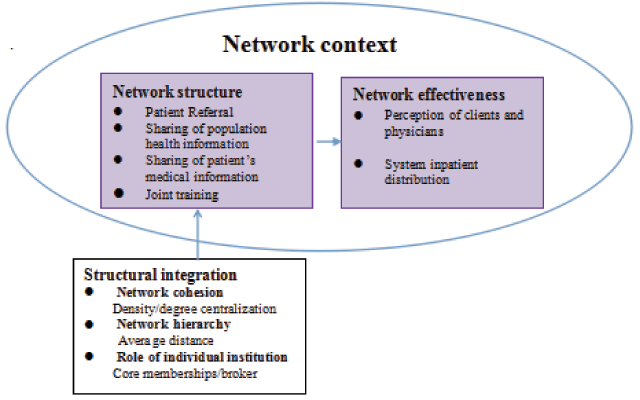
Figure 1
Measurement and indicators of network effectiveness evaluation [36].
Table 3
Network integration measurement.
| Indicator | Referral network | Population health information sharing network | Patient’s health information sharing network | Joint training network | ||||
|---|---|---|---|---|---|---|---|---|
| Huangzhong | Hualong | Huangzhong | Hualong | Huangzhong | Hualong | Huangzhong | Hualong | |
| Density | 0.095 | 0.117 | 0.110 | 0.093 | 0.423 | 0.424 | 0.123 | 0.102 |
| Degree centralization | 0.220 | 0.428 | 0.203 | 0.160 | 0.189 | 0.145 | 0.546 | 0.693 |
| Avg Distance | 2.667 | 1.750 | 2.50 | 2.00 | — | — | 1.75 | 3.0 |
| Core memberships | CH1/CH3/THC1/THC2/THC3 | PH1/CH1/THC1/THC2/THC3 | CDC/MCH/THC1/THC2/THC3 | CHD/MCH/THC1/THC2/THC3 | CH1/CH2/CH3/MCH/THC1/THC2/THC3 | CH1/CH2/MCH/THC1/THC2/THC3 | CH1/MCH/THC1/THC2/V22 | CH1/MCH/THC1/THC2/THC3 |
| Brokerage roles | Coordinator: CH1/THC1/THC2/THC3 Representative: THC2/THC3 | Coordinator: CH1/THC1/THC2/THC3 Representative: CH1/THC2 | — | — | — | — | Coordinator: CH1/CH3/MCH/THC1/THC2/THC3 Representative: CH1/MCH | Coordinator: CH1/MCH/CDC/THC1/THC2/THC3 Representative: MCH/THC2 |
Table 4
Participants’ experience of network effectiveness.
| Dimension | Indicator | Results | |
|---|---|---|---|
| Huangzhong | Hualong | ||
| Referral network | Percentage of doctors who referred patients | 97.44 | 77.78 |
| Patient satisfaction with referral | 71.43 | 63.75% | |
| Sharing of basic health information for population | Percentage of doctors who used e-health record | 64.10 | 40.74 |
| Sharing of medical information for patients | Percentage of doctors who recognize patients’ medical information from same-level institutions | 39.40 | 47.62 |
| Joint training network | Percentage of doctors who went to upper institutions for training (in 2013) | 84.62 | 59.26 |
| Patient satisfaction with doctors’ ability | 89.29 | 87.5 | |
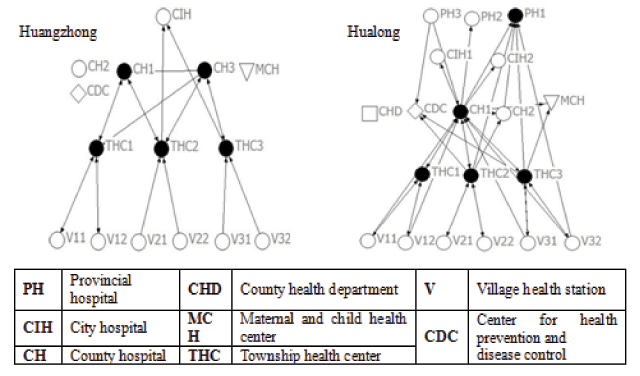
Figure 2
Referral Networks.
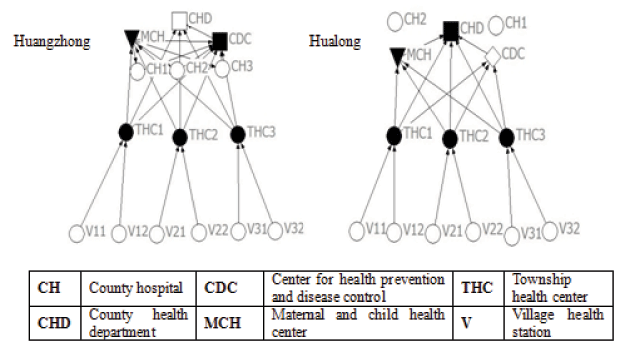
Figure 3
Population health information sharing networks.
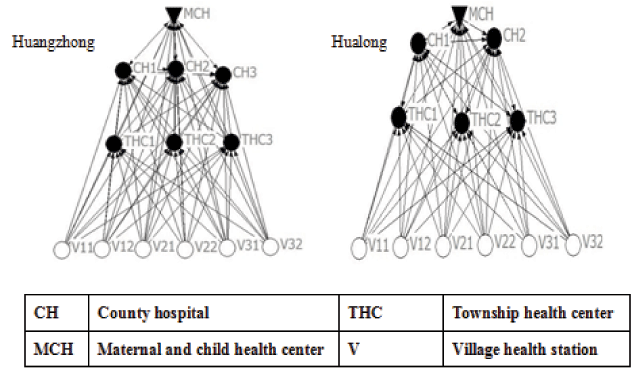
Figure 4
Patient’s medical information sharing networks.
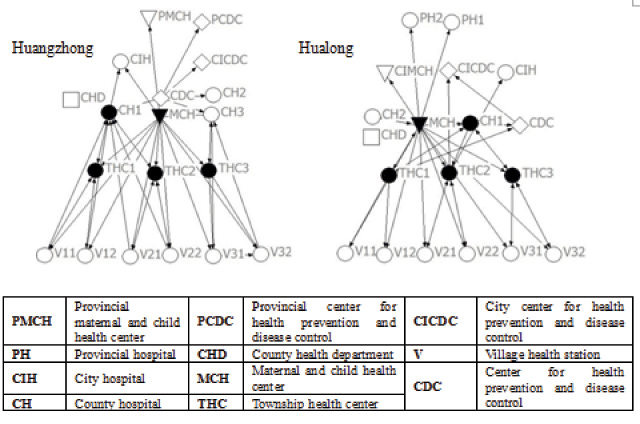
Figure 5
Joint Training Networks.