
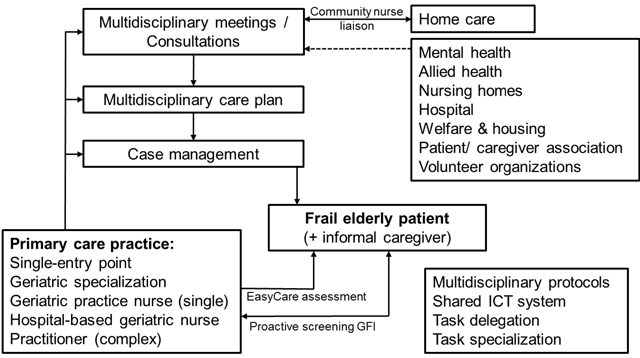
Figure 1
The Walcheren Integrated Care Model.
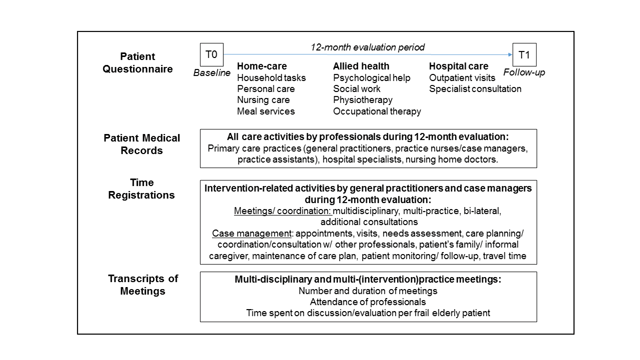
Figure 2
Objective burden data collection.
| Primary care practice professionals | Patient-related | Non-patient related | ||
| Consultation by phone | 5 | Mail processing | 0.5 | |
| Consultation | 10 | Repeated prescription | 3 | |
| Double consultation | 25 | Consultation with general practitioner | 5 | |
| Visit | 10 | Consultation other practice | 5 | |
| Double visit | 25 | Consultation nursing home | 5 | |
| Visit (+30 min.) | 35 | Consultation specialist | 5 | |
| Other activities | 0.5 | Other consultations | 0.5 | |
| Hospital specialists | Patient-related | Non-patient related | ||
| Academic hospital | Outpatient consultation | 15 | Administration | 5 |
| General hospital | Outpatient consultation | 10 | Administration | 3 |
| Allied health professionals | Patient-related | Non-patient related* | ||
| Duration of session | 30 | – | ||
| Duration of session | 60 | – |
[i] *Not available. Other activities = injections, glucose measurement, urine checks; other consultations = patient’s family, other professionals.
Table 1
Questionnaire response and description of study population.
| Response (n/n) | Professionals (n = 180) | Control group (n = 120) | Experimental group (n = 60) |
|---|---|---|---|
| Primary care (28/48) | General practitioner* | 3 | 7 |
| Practice nurse/case manager* | 3 | 5 | |
| Practice assistant | 5 | 5 | |
| Home-care (152/578) | Domestic helper | 85 | 36 |
| Registered nurse | 24 | 7 | |
| Control variables | Women (%) | 97% | 90% |
| Men (%) | 3% | 10% | |
| Age (M, SD) | 44.6 (12.7) | 43.7 (11.6) | |
| Years in current position (M, SD) | 9.1 (8.3) | 8.4 (7.6) | |
| Hours per week (M, SD) | 20.8 (9.6) | 22.3 (11.5) |
[i] * p < 0.05; M = mean; SD = standard deviation.
Table 2
Linear regression analyses with job satisfaction scores (T1) as dependent variable, and baseline scores (T0), control variables and the intervention as independent variables.
| Predictors Baseline | Gender | Age | No. hours | No. years | Practice | Intervention | ||||||||||||||||
|---|---|---|---|---|---|---|---|---|---|---|---|---|---|---|---|---|---|---|---|---|---|---|
| Dimensions (1–7) | Adj.R2 | B | SE | β | B | SE | β | B | SE | β | B | SE | β | B | SE | β | B | SE | β | B | SE | β |
| Responsibility | .15 | 0.32 | 0.06 | .36 | 0.01 | 0.31 | .00 | 0.01 | 0.01 | .07 | 0.00 | 0.01 | .01 | –0.03 | 0.01 | –.24 | 0.37 | 0.18 | .16 | –0.07 | 0.13 | –.04 |
| Variation | .27 | 0.53 | 0.07 | .51 | 0.36 | 0.31 | .09 | 0.01 | 0.01 | .08 | 0.01 | 0.01 | .05 | –0.01 | 0.01 | –.09 | 0.44 | 0.19 | .17 | –0.07 | 0.13 | –.04 |
| Colleagues | .40 | 0.43 | 0.05 | .52 | 0.09 | 0.30 | .02 | –0.02 | 0.01 | –.23 | 0.01 | 0.01 | .10 | –0.01 | 0.01 | –.09 | 0.30 | 0.18 | .11 | –0.02 | 0.13 | –.01 |
| Physical conditions | .59 | 0.69 | 0.05 | .73 | –0.21 | 0.28 | –.05 | 0.02 | 0.01 | .16 | –0.01 | 0.01 | –.06 | –0.02 | 0.01 | –.11 | 0.25 | 0.17 | .09 | 0.21 | 0.12 | .09 |
| Skills | .54 | 0.77 | 0.06 | .73 | –0.19 | 0.31 | –.05 | 0.01 | 0.01 | .13 | 0.00 | 0.01 | .01 | –0.02 | 0.01 | –.16 | 0.29 | 0.19 | .09 | 0.10 | 0.13 | .04 |
| General situation | .23 | 0.45 | 0.07 | .44 | –0.01 | 0.01 | –.02 | 0.01 | 0.01 | .08 | 0.00 | 0.01 | .03 | –0.03 | 0.01 | –.25 | 0.25 | 0.20 | .10 | 0.17 | 0.14 | .09 |
| Freedom | .39 | 0.46 | 0.04 | .63 | –0.04 | 0.19 | –.02 | 0.01 | 0.00 | .14 | 0.00 | 0.01 | .05 | –0.02 | 0.01 | –.20 | –0.02 | 0.12 | –.01 | 0.08 | 0.08 | .06 |
| Appreciation | .61 | 0.76 | 0.05 | .77 | 0.38 | 0.27 | .08 | 0.01 | 0.01 | .06 | 0.01 | 0.01 | .07 | –0.00 | 0.01 | –.03 | 0.14 | 0.16 | –.05 | –0.07 | 0.12 | –.03 |
| Remuneration | .82 | 0.92 | 0.03 | .92 | 0.08 | 0.24 | .01 | –0.00 | 0.01 | –.03 | –0.00 | 0.01 | –.02 | 0.00 | 0.01 | .02 | –0.06 | 0.15 | –.02 | –0.04 | 0.10 | –.01 |
| Hours | .75 | 0.84 | 0.04 | .86 | 0.10 | 0.21 | .02 | 0.10 | 0.00 | .11 | –0.00 | 0.01 | –.02 | –0.02 | 0.01 | –.14 | 0.21 | 0.13 | .07 | –0.05 | 0.09 | –.02 |
| Total satisfaction | .37 | 0.53 | 0.05 | .61 | –1.26 | 1.80 | –.05 | 0.02 | 0.03 | .04 | –0.01 | 0.04 | –.02 | –0.07 | 0.05 | –.10 | –1.06 | 1.07 | –.07 | –1.02 | 0.76 | –.08 |
[i] Adj.R2 = Adjusted Explained Variance; B = Unstandardized Coefficient; SE = standard error; β = Standardized Coefficient (Bold = p < 0.05). All reported regression models were significant (p < 0.001).
Table 3
Mean and Standard Deviation of professionals’ time investments in minutes per frail elderly patient over the 12-month evaluation period for the control and experimental group.
| Control group (n = 193 patients) | Experimental group (n = 184 patients) | |||||||||||
|---|---|---|---|---|---|---|---|---|---|---|---|---|
| Total | Patient-related | Non-patient related | Total | Patient-related | Non-patient related | |||||||
| Type of professional | M | SD | M | SD | M | SD | M | SD | M | SD | M | SD |
| All professionals | 11547 | 15733 | 11517 | 15726 | 30 | 41 | 12926 | 14439 | 12576 | 14433 | 350 | 194 |
| Home-care | 10989 | 15490 | – | – | – | – | 11833 | 14265 | – | – | – | |
| Allied health | 369 | 907 | – | – | – | – | 352 | 1054 | – | – | – | |
| Hospital specialist | 23 | 24 | 18 | 19 | 5 | 6 | 23 | 29 | 18 | 22 | 5 | 7 |
| Primary care practice* | 165 | 159 | 140 | 130 | 25 | 40 | 212 | 129 | 146 | 103 | 66 | 45 |
| Case manager | – | – | – | – | – | – | 230 | 281 | 115 | 140 | 115 | 151 |
| General practitioner | 86 | 76 | 83 | 73 | 3 | 7 | 136 | 81 | 86 | 66 | 51 | 34 |
| Practice assistant | 52 | 86 | 32 | 65 | 19 | 35 | 24 | 25 | 15 | 20 | 9 | 10 |
| Practice nurse | 27 | 47 | 25 | 40 | 2 | 9 | 49 | 69 | 43 | 63 | 6 | 12 |
[i] *Excluding case managers. M = Mean; SD = standard deviation. Bold = p < 0.05.
Table 4
Linear regression analyses with total, patient-, and non-patient related time investments as dependent variables, and frailty and the intervention as independent variables.
| Time-investments | |||||||||||||
|---|---|---|---|---|---|---|---|---|---|---|---|---|---|
| Total | Patient-related | Non-patient related | |||||||||||
| Type of professionals | Predictor | Adj. R2 | B | SE | β | Adj. R2 | B | SE | β | Adj. R2 | B | SE | β |
| All professionals | Frailty | 0.12 | 2802 | 393 | .346 | 0.12 | 2792 | 393 | .345 | 0.02 | 10 | 4 | .089 |
| Intervention | 0.12 | 665 | 1466 | .022 | 0.12 | 348 | 1467 | .012 | 0.58 | 317 | 14 | .751 | |
| Primary care practice | Frailty | 0.02 | 10 | 4 | .134 | n.s. | – | – | – | 0.02 | 3 | 1 | .110 |
| Intervention | 0.04 | 44 | 15 | .151 | n.s. | – | – | – | 0.20 | 41 | 4 | .432 | |
| General practitioner | Frailty | 0.04 | 8 | 2 | .176 | 0.03 | 6 | 2 | .169 | 0.01 | 2 | 1 | .080 |
| Intervention | 0.12 | 49 | 8 | .294 | 0.02 | 1 | 7 | .011 | 0.49 | 47 | 3 | .699 | |
| Practice assistant | Frailty | 0.00 | 2 | 2 | .060 | 0.00 | 1 | 1 | .047 | 0.00 | 1 | 1 | .060 |
| Intervention | 0.05 | –29 | 7 | –.220 | 0.03 | –18 | 5 | –.177 | 0.04 | –11 | 3 | –.211 | |
| Practice nurse | Frailty | 0.00 | 0 | 2 | .010 | 0.00 | 0 | 1 | –.001 | 0.00 | 0 | 0 | .059 |
| Intervention | 0.03 | 22 | 6 | .182 | 0.02 | 18 | 5 | .171 | 0.03 | 4 | 1 | .172 | |
| Home-care | Frailty | 0.11 | 2720 | 389 | .341 | – | – | – | – | – | – | – | – |
| Intervention | 0.11 | 152 | 1449 | .005 | – | – | – | – | – | – | – | – | |
| Hospital | Frailty | n.s. | – | – | – | n.s. | – | – | – | n.s. | – | – | – |
| Intervention | n.s. | – | – | – | n.s. | – | – | – | n.s. | – | – | – | |
| Allied health | Frailty | n.s. | – | – | – | – | – | – | – | – | – | – | – |
| Intervention | n.s. | – | – | – | – | – | – | – | – | – | – | – | |
[i] Adj.R2 = Adjusted Explained Variance; B = Unstandardized Coefficient; SE = standard error; β = Standardized Coefficient (Bold = p < 0.05); n.s.= regression model not significant. Note: Values of B and SE are rounded up.