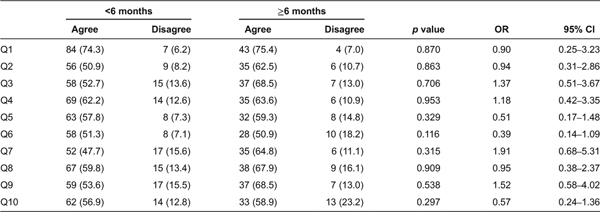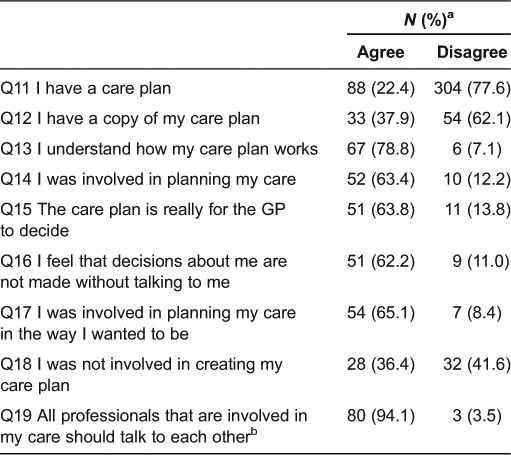
Table 2.
Overall patient experience (N = 405)
aThe remaining percentage (from 100%) for each row and group pertains to neutral responses.
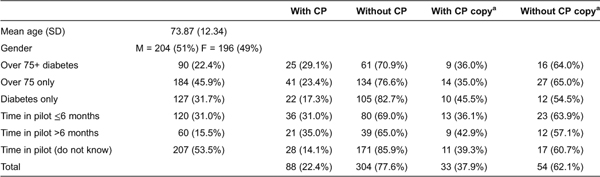
Table 3.
Patient experience according to care plan status, N (%)a
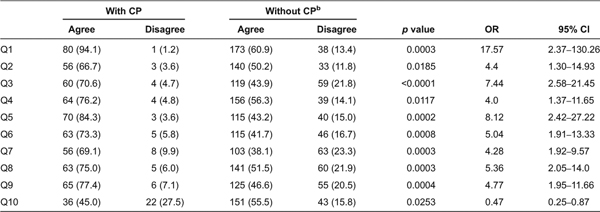
aThe remaining percentage (from 100%) for each row and group pertains to neutral responses.
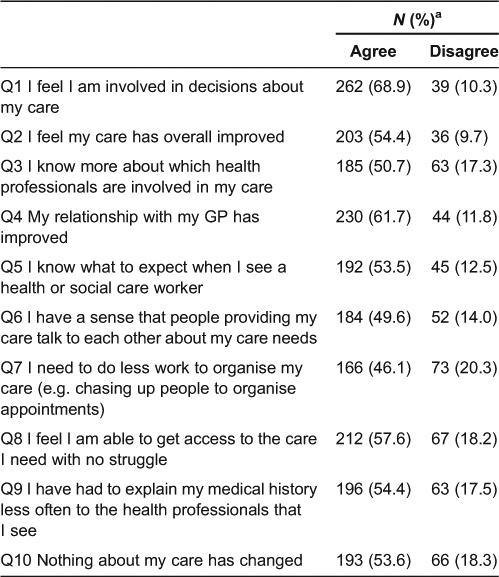
bAll patients were registered as having a care plan, but the majority were not aware of having one.