
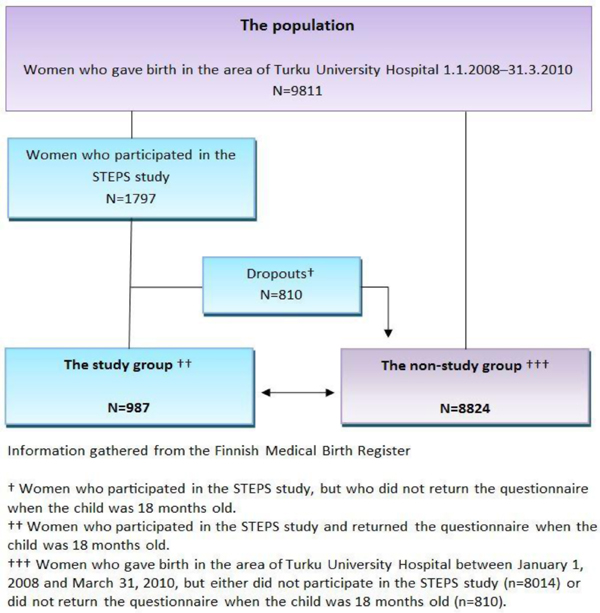
Figure 1.
The formation of the study group and the drop-out analysis (women)
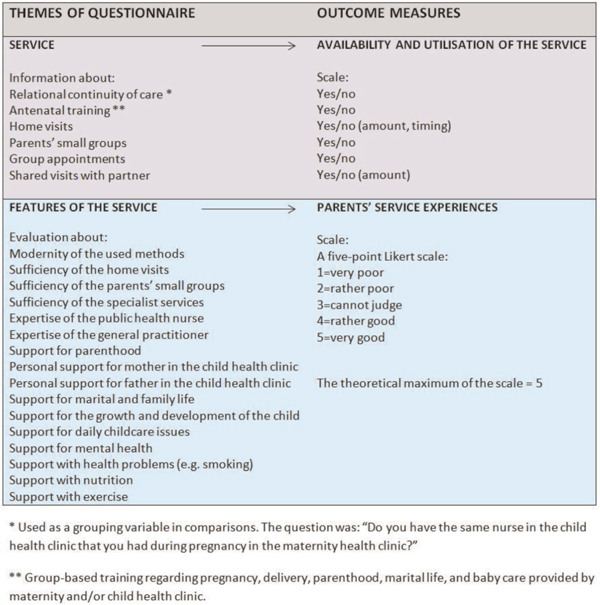
Figure 2.
The composition of the questionnaire for the evaluation of the maternity and child health clinic services
Table 1.
Sociodemographic characteristics of the participating parents in the STEPS study's 18 month follow-up
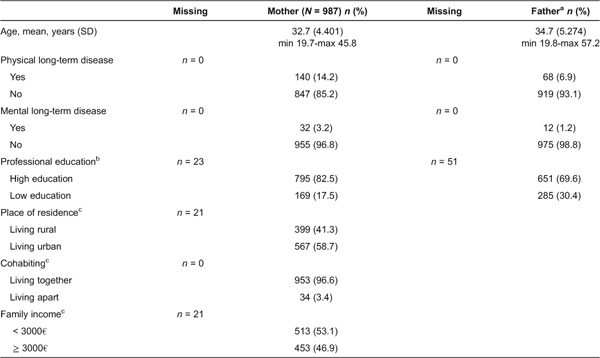
aInformation regarding fathers is based on the report of the mothers (N = 987).
bHigh education = degree from university, polytechnic/university of applied sciences or college, low education = other degrees/no degrees.
cInformation regarding family's situation is based on the report of the mothers.
Table 2.
National Birth Register characteristics of the participant mothers – a comparison between participants and non-participants
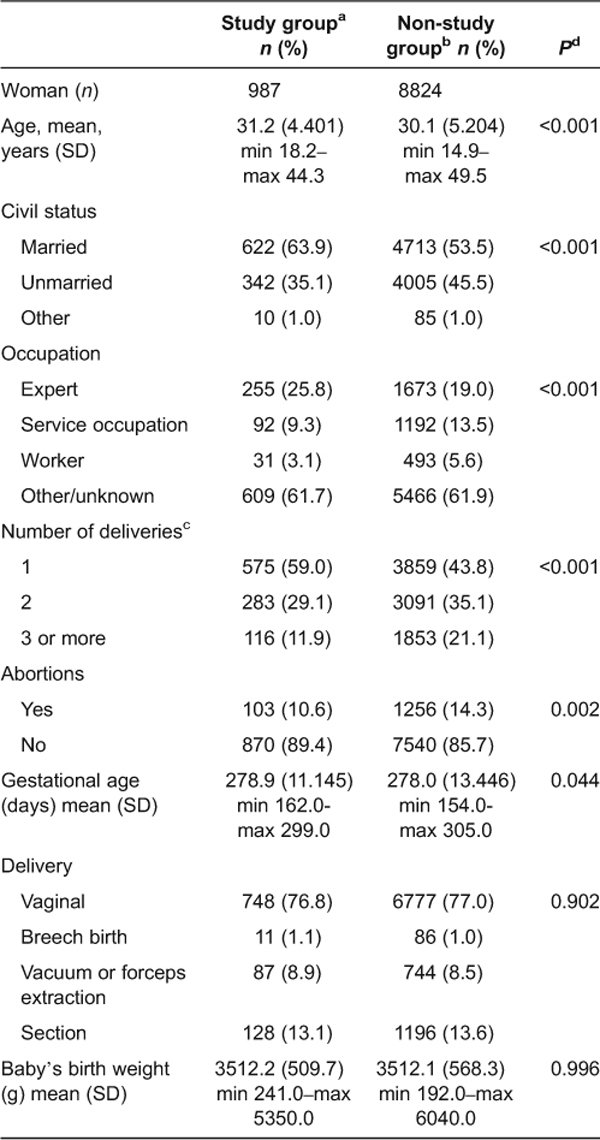
Information gathered from the Finnish Medical Birth Register (2013).
aWomen who participated into the STEPS study's 18 months follow-up and gave birth between 1 January 2008 and 31 March 2010 in the area of the Turku University Hospital.
bWomen who did not participate into the STEPS study and gave birth between 1 January 2008 and 31 March 2010 in the area of the Turku University Hospital.
cDefined at the STEPS study's 18 months follow-up.
dUsed statistical test: Pearson's chi-square.
Table 3.
The availability and utilisation of the maternity and child health clinic services in relation to the relational continuity of care reported by the mothers (N = 987)
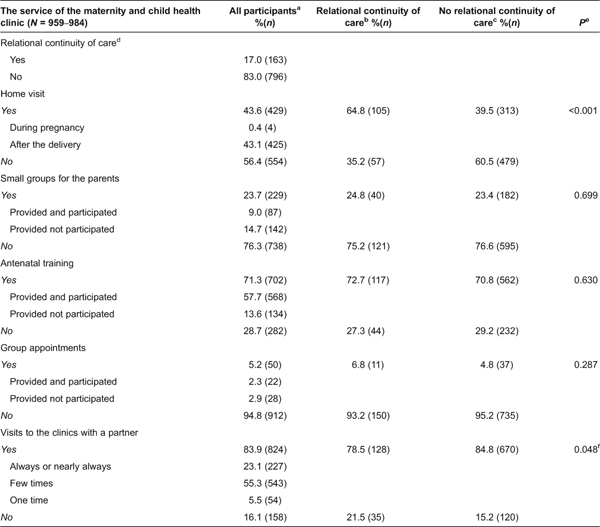
aIncludes participants without information on relational continuity of care.
bThe same nurse takes care of family in the maternity health clinic and child health clinic.
cDifferent nurses take care of the family in the maternity health clinic and child health clinic.
dInformation on relational continuity of care was known of 97.2% (N = 959) of the study participants. Because of this and the different response rates between the questions, a variation in total and group-based frequencies and percentages exists.
eThe statistical test (Pearson's chi-square) was performed for the dichotomised variables (yes/no).
fDifference was explained by the primiparity and parents’ lower age in the binary logistic regression analysis.
Table 4.
Mothers’ (N = 987) and fathers’ (N = 835) ‘good’ service evaluations in relation to relational continuity of care in the maternity and child health clinics
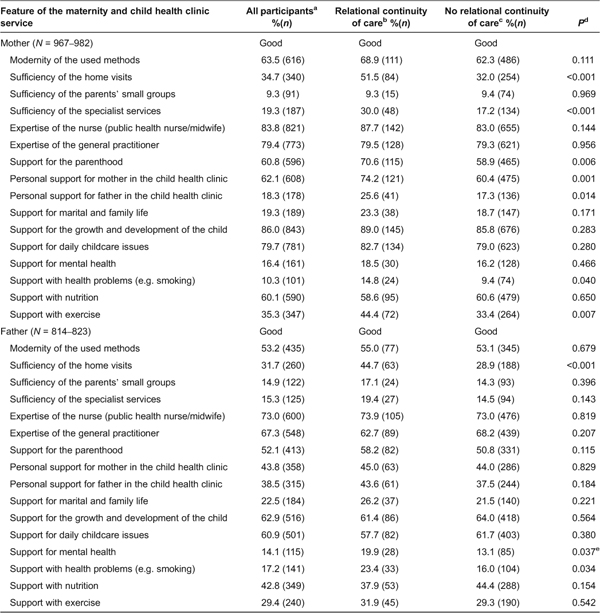
Information of relational continuity of care was known of 97.2% (N = 959) of the study participants. Because of this, and the different response rates between the questions, a variation in total and group-based frequencies and percentages exists.
aIncludes participants without information on relational continuity of care.
bSame nurse takes care of family in maternity health clinic and in child health clinic.
cDifferent nurses take care of family in maternity health clinic and in child health clinic.
dUsed statistical test: Pearson's chi-square.
eDifference was explained by partners’ higher professional education in the binary logistic regression analysis.