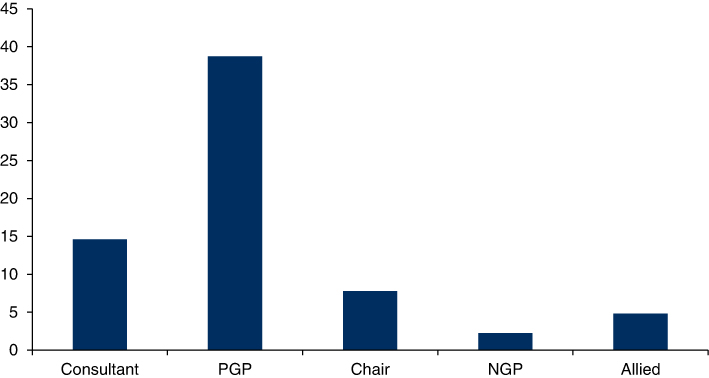
Figure 1.
Distribution of utterances (%) per participant type and MDG (For all MDGs Consultants = 2, PGP = 1, Chair = 1; For MDG 1 NGP = 6, MDG 2 NGP = 4, MDG 3 NGP = 3 and MDG 4 NGP = 4; For MDG 1 Allied = 3, MDG 2 Allied = 3, MDG 3 Allied = 5, MDG 4 Allied = 2). MDG, Multidisciplinary Group; NGP, non-presenting general practitioner.
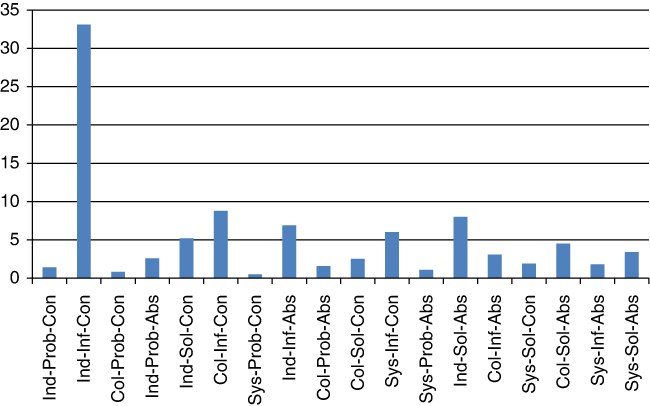
Figure 2.
Proportion of all utterances (all MDGs) by trivalent Event Code domain (does not include uncodeable utterances). Ind, Individual; Col, Collective; Sys, System; Prob, Problem; Inf, Information; Sol, Solution; Con, Concrete; Abs, Abstract.
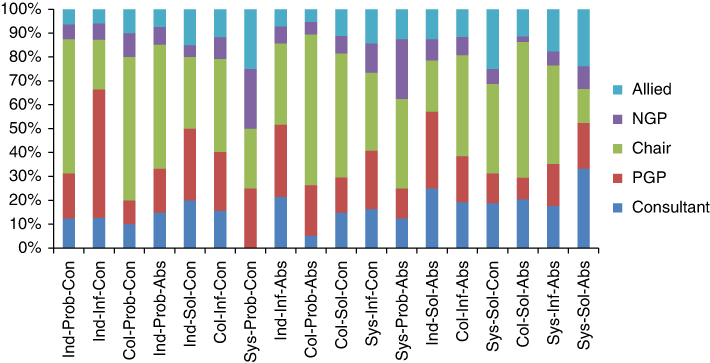
Figure 3.
Proportion of Event Codes by participant type for all MDGs (does not include uncodeable utterances). Ind, Individual; Col, Collective; Sys, System; Prob, Problem; Inf, Information; Sol, Solution; Con, Concrete; Abs, Abstract.
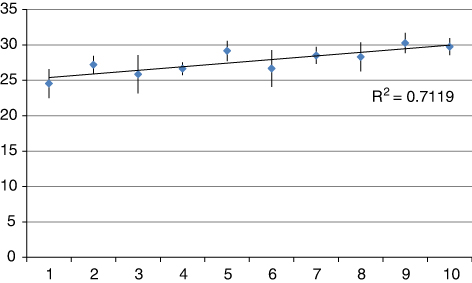
Figure 4.
Average Standardised Weighted Integration Intensity Score per time decile of Case Discussions (with standard deviation shown).