
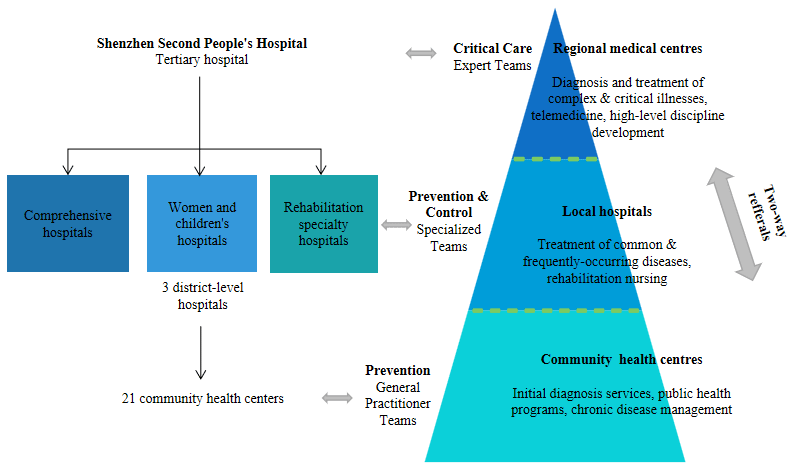
Figure 1
Organisational structure of Shenzhen Dapeng New District Medical and Health Group.
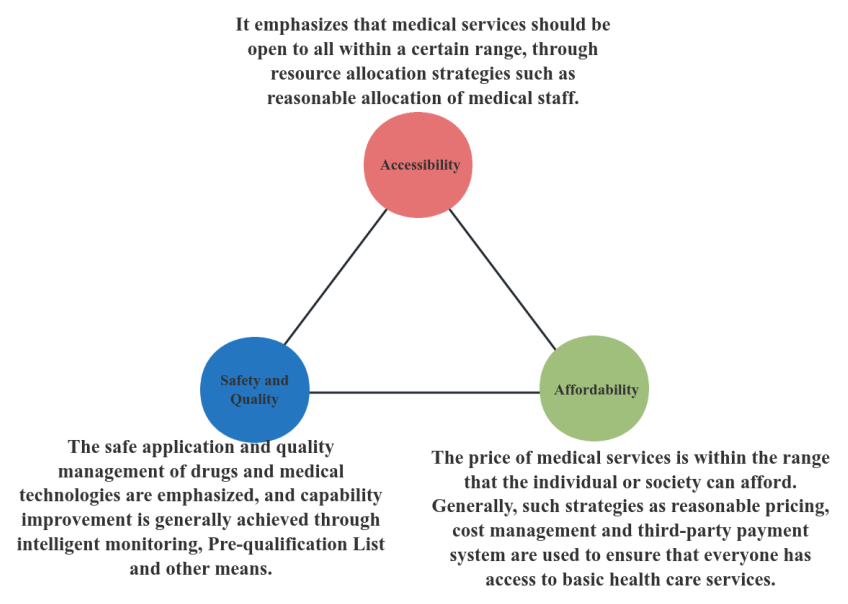
Figure 2
The analytical framework of assessing integrated healthcare model.
Table 1
Evaluation Indicators and Calculation Formula.
| DIMENSION | EVALUATION INDICATOR | CALCULATION FORMULA |
|---|---|---|
| Accessibility | Number of beds per 1,000 population | (Number of Beds in Medical Institutions/Resident Population) × 1,000 |
| Number of physicians and physician assistants per 1,000 population | (Number of Physicians + Assistant Physicians)/Resident Population × 1,000 | |
| Number of registered nurses per 1,000 population | Number of Registered Nurses in Medical Institutions/Resident Population × 1,000 | |
| Quality | Number of level III/IV surgeries | Number of Level III Surgeries + Number of Level IV Surgeries |
| Number of type C/D cases | Number of Type C Cases + Number of Type D Cases | |
| Affordability | Proportion of medical insurance patients | Number of Patients Reimbursed by medical insurance/Total Number of Patients |
| Proportion of medical revenue from medical insurance | Medical insurance fund revenue/medical revenue |
[i] Note: Surgical procedures are classified into four levels (I–IV) based on risk and complexity; level III/IV surgeries denote those that are relatively complex, technically demanding, and high-risk. Cases are categorised into four types (A-D) according to illness severity; type C/D cases represent conditions that are complex and present high diagnostic difficulty.
Table 2
Impact of the reform on the service performance of primary care institutions.
| DIMENSION | INDICATOR | MODEL | N | β0 | β1 | β2 | β3 | DW | AR(1)ρ | R2 |
|---|---|---|---|---|---|---|---|---|---|---|
| Accessibility | Number of beds per 1,000 population | Prais-Winsten | 48 | 1.807*** (0.083) | 0.024** (0.006) | 0.186 (0.095) | 0.031** (0.008) | 1.955 | 0.451 | 0.925 |
| Number of physicians and physician assistants per 1,000 population | OLS | 48 | 1.290*** (0.098) | 0.011 (0.008) | 0.386** (0.125) | –0.006 (0.009) | 1.653 | — | 0.648 | |
| Number of registered nurses per 1,000 population | OLS | 48 | 1.383*** (0.059) | 0.021** (0.005) | 0.152* (0.075) | –0.006 (0.006) | 1.757 | — | 0.861 | |
| Quality | Number of level III/IV surgeries | OLS | 48 | –3.803 (31.279) | 0.989 (2.491) | 3.768 (39.96) | 14.498*** (3.020) | 2.080 | — | 0.829 |
| Number of type C/D cases | Prais-Winsten | 48 | 234.760* (103.363) | 6.862 (7.815) | 125.046 (110.134) | 51.743*** (10.430) | 1.940 | 0.344 | 0.863 | |
| Affordability | Proportion of medical insurance patients | OLS | 48 | 0.290*** (0.028) | 0.010** (0.002) | 0.085* (0.035) | –0.002 (0.003) | 2.220 | — | 0.883 |
| Proportion of medical income from medical insurance | OLS | 48 | 0.408*** (0.026) | 0.005 (0.002) | 0.113** (0.033) | –0.001 (0.003) | 2.360 | — | 0.803 |
[i] Notes: Standard errors are shown in parentheses. *p < 0.05, **p < 0.01, ***p < 0.001. Ordinary Least Squares (OLS) was used when the DW statistic was close to 2 (indicating no significant serial autocorrelation). Prais-Winsten generalised least squares with AR(1) correction was applied when the DW statistic deviated substantially from 2, to account for first-order autocorrelation. AR(1)ρ: first-order autocorrelation coefficient; values near 0 indicate weak autocorrelation. For OLS models, “—” indicates not applicable. For Prais-Winsten models, DW is the transformed value.
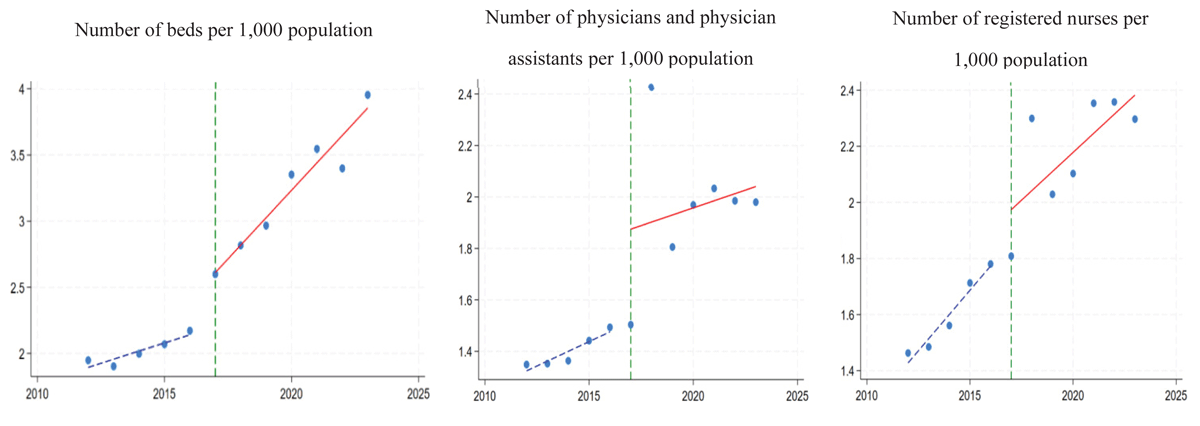
Figure 3
Trends in accessibility evaluation indicators before and after reform.
Table 3
Two-way referral volumes and CHCs outpatient share within the Healthcare Group.
| YEAR | TERTIARY ⇋ DISTRICT HOSPITALS | DISTRICT HOSPITALS ⇋ CHCS | THE PROPORTION OF OUTPATIENT VISITS AT CHCS | ||
|---|---|---|---|---|---|
| DOWN | UP | DOWN | UP | ||
| 2017 | 115 | 105 | 1154 | 7951 | – |
| 2018 | 301 | 282 | 1282 | 11000 | – |
| 2019 | 584 | 306 | 1374 | 17307 | 28.13% |
| 2020 | 205 | 461 | 1954 | 12248 | 26.96% |
| 2021 | 234 | 341 | 3877 | 26721 | 39.76% |
| 2022 | 206 | 347 | 1583 | 28580 | 57.29% |
| 2023 | 170 | 240 | 7480 | 23513 | 55.43% |
| Overall | 1815 | 2082 | 18704 | 127320 | – |
[i] Notes: DOWN: Downward referrals; UP: Upward referrals.
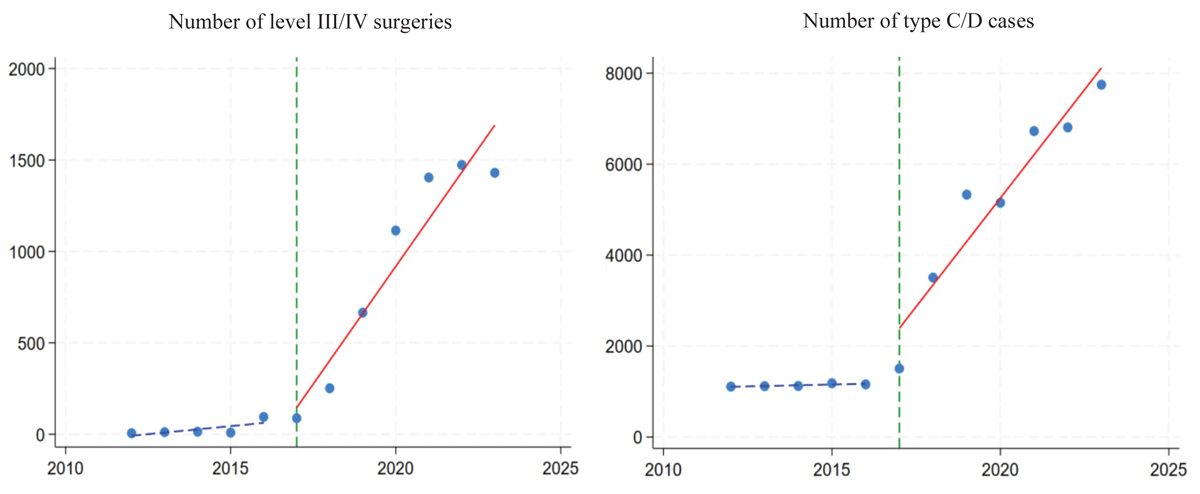
Figure 4
Trends in quality evaluation indicators before and after reform.
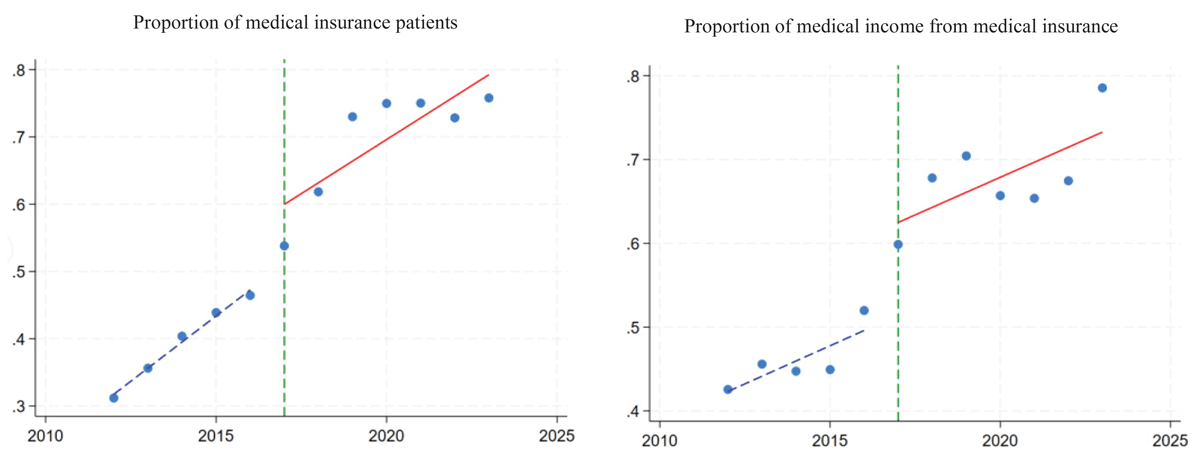
Figure 5
Trends in affordability evaluation indicators before and after reform.
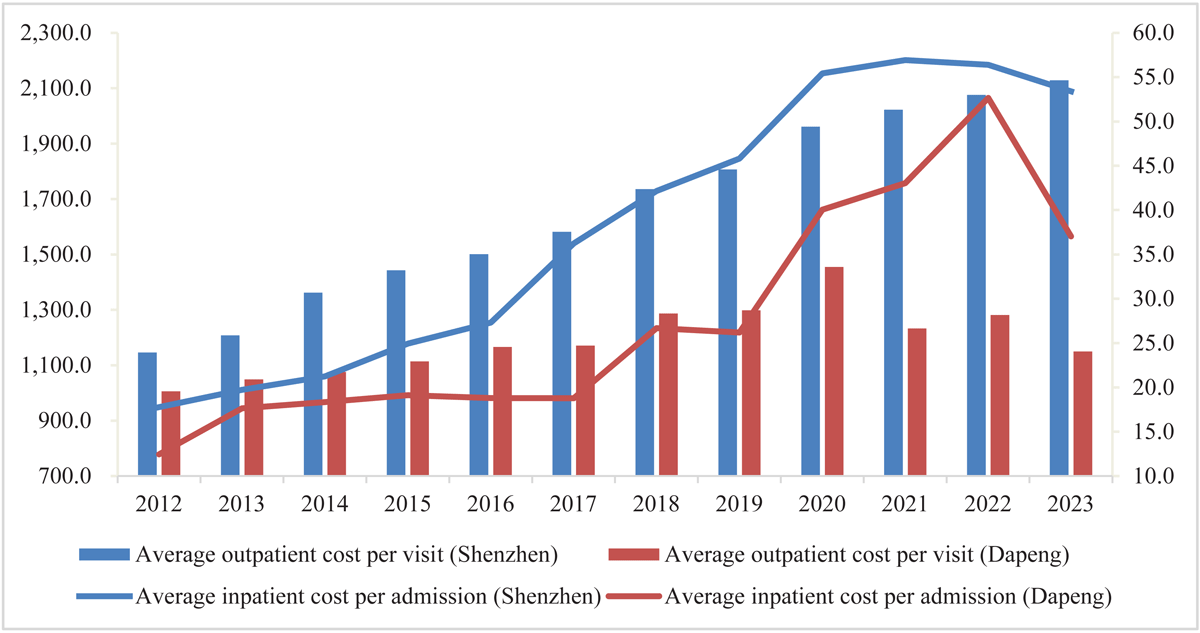
Figure 6
Average outpatient cost per visit and inpatient cost per admission in Shenzhen and Dapeng (2012–2023).
Notes: The Consumer Price Index (CPI) varied minimally over the period (index 100.2–102.9), so values are shown in nominal terms without inflation adjustment. Costs are presented in US dollars (US$), converted from RMB at the period-average exchange rate of US$1 = 6.5757 (2012–2023) [42].
Table 4
Transferability of key institutional features of the Dapeng model.
| INSTITUTIONAL FEATURE | ROLE IN THE DAPENG MODEL | TRANSFERABILITY | KEY CONDITION FOR REPLICATION |
|---|---|---|---|
| Vertical integration of municipal hospitals, district hospitals, and CHCs | Links advanced care, district-level services, and first-contact primary care | High | Existence of a referral network and willing lead hospital |
| Unified governance structure with a shared legal representative and group leadership | Reduces fragmentation, clarifies accountability, and strengthens coordination across member institutions | Moderate | Requires compatible public hospital governance rules and strong administrative coordination |
| Standardised two-way referral pathways | Supports tiered care and continuity between CHCs and hospitals | High | Shared referral standards and reserved referral capacity |
| Shared diagnostic, pharmacy, and information platforms | Improves resource sharing and reduces duplication | High | Digital infrastructure and interoperable information systems |
| Integrated performance management | Aligns incentives across member institutions | Moderate | Requires comparable indicators and enforceable evaluation rules |
| Family-doctor teams and CHC gatekeeping | Strengthens first-contact care and chronic disease management | High | Sufficient primary care workforce and community trust |
| Three-level government–hospital collaboration | Provides political support and cross-level coordination | Context-specific | Depends on local government capacity and intergovernmental cooperation |
| Separation of ownership and operating rights | Allows district institutions to retain ownership while integrating operations | Context-specific | Depends on local public asset and hospital management regulations |
| “Four unchanged” principle, including affiliation, personnel identity, asset ownership, and fiscal input | Reduces resistance during integration | Context-specific | Requires stable public-sector employment and fiscal arrangements |
| Local fiscal support and appointed financial oversight | Supports implementation and financial accountability | Context-specific | Depends on fiscal capacity and public financing mechanisms |
| Staffing and talent development arrangements | Supports technical diffusion but remains a bottleneck | Moderate to low | Requires workforce mobility, incentives, and career pathways |