
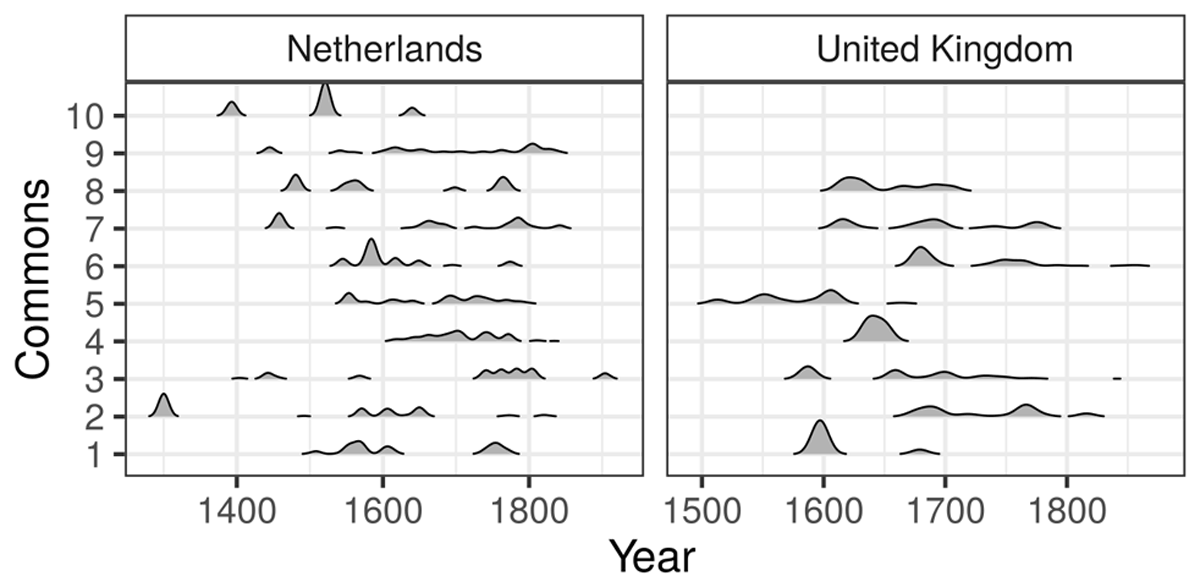
Figure 1
Overview of regulatory activities in the dataset. The figure shows the density of regulatory activities per year and commons.
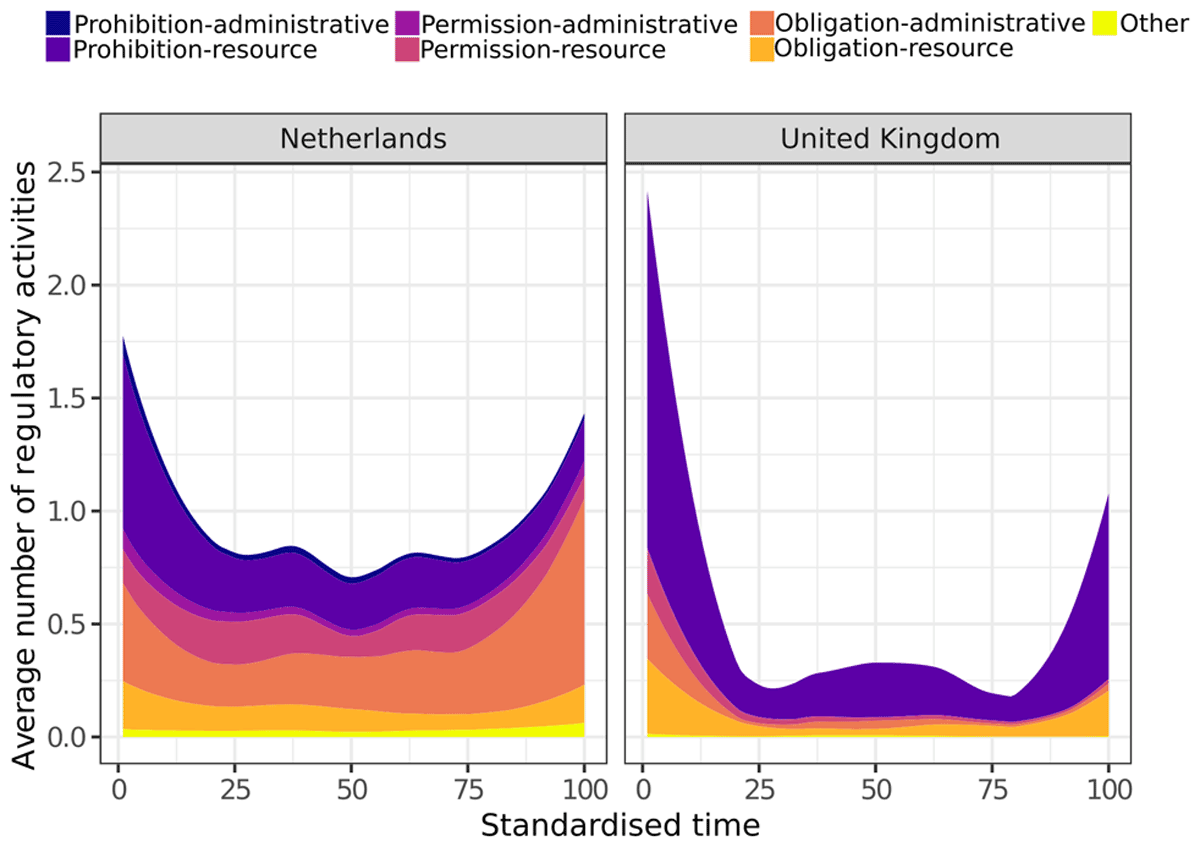
Figure 2
Smoothed estimates of regulatory activities during the existence of a common by category (deontic and aim).
Table 1
Fixed effects estimates for the generalized mixed effects model using the number of regulatory activities as outcome. The model also includes random effects for commons. We present robustness checks in the Appendix.
| Estimate | SE | z | p | |
|---|---|---|---|---|
| Intercept | 1.05207 | 0.25737 | 4.085 | 0.000 |
| year | –0.00989 | 0.00074 | –13.295 | 0.000 |
| year2 | 0.00002 | 0.00000 | 14.993 | 0.000 |
| UK | 0.57616 | 1.27629 | 0.451 | 0.652 |
| year × UK | 0.00777 | 0.00645 | 1.204 | 0.229 |
| year2 × UK | –0.00001 | 0.00000 | –3.262 | 0.001 |
Table 2
Fixed effects estimates for the mixed effects model using the proportion of strictly administrative changes as outcome. The model also includes random effects for commons.
| Estimate | SE | t | p | |
|---|---|---|---|---|
| Intercept | 0.10055 | 0.08370 | 1.201 | 0.230 |
| year | 0.00114 | 0.00019 | 6.083 | 0.000 |
| UK | –0.18116 | 0.21052 | –0.861 | 0.389 |
| N. of rule changes | –0.00094 | 0.00115 | –0.819 | 0.413 |
| year × UK | –0.00066 | 0.00052 | –1.263 | 0.207 |
Table 3
Fixed effects estimates for the mixed effects model using the ratio of sanctioning rules as outcome. The model also includes random effects for commons.
| Estimate | SE | t | p | |
|---|---|---|---|---|
| Intercept | 0.74927 | 0.08984 | 8.340 | 0.000 |
| year | –0.00115 | 0.00019 | –6.185 | 0.000 |
| UK | 0.06184 | 0.22530 | 0.274 | 0.784 |
| N. of rule changes | 0.00099 | 0.00120 | 0.827 | 0.408 |
| year × UK | 0.00112 | 0.00055 | 2.049 | 0.040 |
Table 4
Fixed effects estimates for the generalized mixed effects model using the number of regulatory activities as outcome with added zeros to both ends of the life-span of a common. Random effects for commons were included in the model.
| Estimate | Std. Error | z | p | |
|---|---|---|---|---|
| Intercept | 0.54361 | 0.24 | 2.26 | 0.024 |
| year | –0.00692 | 0.00 | –9.39 | 0.000 |
| year2 | 0.00001 | 0.00 | 11.01 | 0.000 |
| UK | –1.64529 | 1.15 | –1,43 | 0.152 |
| year × UK | 0.01629 | 0.00 | 2.79 | 0.005 |
| year2 × UK | –0.00001 | 0.00 | –4.63 | 0.000 |
Table 5
Fixed effects estimates for the generalized mixed effects model using the number of regulatory activities classified as Prohibition-Resources.
| Estimate | Std. Error | z | p | |
|---|---|---|---|---|
| Intercept | 1.02093 | 0.35 | 2.88 | 0.004 |
| year | –0.01600 | 0.00 | –10.73 | 0.000 |
| year2 | 0.00002 | 0.00 | 9.63 | 0.000 |
| UK | 0.06915 | 1.55 | 0.04 | 0.964 |
| year × UK | 0.01316 | 0.01 | 1.66 | 0.097 |
| year2 × UK | –0.00001 | 0.00 | –2.85 | 0.004 |
Table 6
Fixed effects estimates for the generalized mixed effects model using the number of regulatory activities classified as Obligation-Administrative.
| Estimate | Std. Error | z | p | |
|---|---|---|---|---|
| Intercept | –0.54581 | 0.36 | –1.51 | 0.132 |
| year | –0.01093 | 0.00 | –7.48 | 0.000 |
| year2 | 0.00002 | 0.00 | 10.07 | 0.000 |
| UK | –9.43220 | 5.58 | –1.69 | 0.091 |
| year × UK | 0.04995 | 0.03 | 1.78 | 0.075 |
| year2 × UK | –0.00008 | 0.00 | –2.24 | 0.025 |
Table 7
Fixed effects estimates for the generalized mixed effects model using the number of regulatory activities classified as Permission-Resources.
| Estimate | Std. Error | z | p | |
|---|---|---|---|---|
| Intercept | –3.60224 | 0.50 | –7.26 | 0.000 |
| year | 0.00486 | 0.00 | 2.29 | 0.022 |
| year2 | –0.00000 | 0.00 | –1.27 | 0.205 |
| UK | 7.21401 | 4.08 | 1.77 | 0.077 |
| year × UK | –0.03003 | 0.02 | –1.38 | 0.167 |
| year2 × UK | 0.00002 | 0.00 | 0.63 | 0.529 |
Table 8
Fixed effects estimates for the generalized mixed effects model using the number of regulatory activities classified as Obligation-Resources.
| Estimate | Std. Error | z | p | |
|---|---|---|---|---|
| Intercept | –0.34023 | 0.45 | –0.75 | 0.451 |
| year | –0.01592 | 0.00 | –7.57 | 0.000 |
| year2 | 0.00002 | 0.00 | 7.59 | 0.000 |
| UK | –1.93459 | 3.45 | –0.56 | 0.575 |
| year × UK | 0.02962 | 0.02 | 1.59 | 0.112 |
| year2 × UK | –0.00006 | 0.00 | –2.51 | 0.012 |