
Table 1
Average seasonal and annual precipitation and their coefficients of variation in agro-ecological zones of the Gandaki River Basin.
| Agro-ecological zone | Winter (mm) | Pre-monsoon (mm) | Monsoon (mm) | Post-monsoon (mm) | Annual (mm) |
|---|---|---|---|---|---|
| Trans-Himalaya | 61.7 (56.5) | 102.7 (34.0) | 342.9 (30.6) | 40.1 (133.9) | 547.4 (25.0) |
| Mountain | 123.1 (104.6) | 198.6 (60.4) | 1100.9 (20.8) | 73.1 (85.1) | 1495.7 (21.5) |
| Hill | 21.4 (60.5) | 381.6 (24.9) | 2880.9 (11.6) | 124.0 (48.3) | 3468.6 (10.3) |
| Terai | 46.8 (85.7) | 219.7 (36.3) | 1601.6 (22.0) | 82.6 (81.5) | 1950.7 (21.9) |
| Gandaki River Basin | 63.2 (72.6) | 225.7 (21.17) | 1481.6 (11.8) | 79.9 (61.6) | 1865.6 (10.7) |
[i] (Source: Panthi et al., 2015).
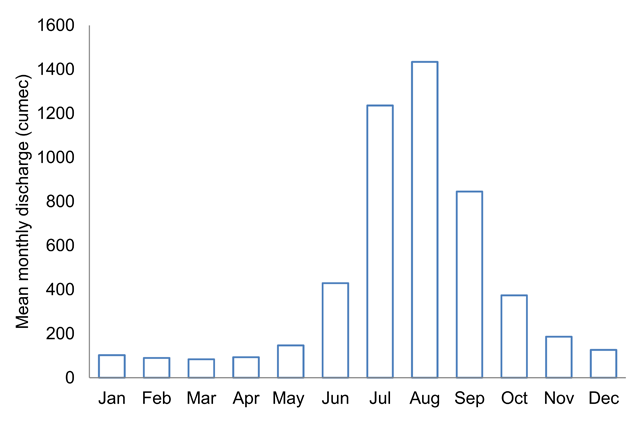
Figure 1
Mean monthly discharge of the Kali Gandaki River (1996–2006) (Bajracharya, Acharya, & Ale, 2011).

Figure 2
Study sites in the Gandaki River Basin of Nepal.
Table 2
Distribution of farmer-managed irrigation systems and households.
| River Category | Mountains | Hills | Terai | Total | ||||
|---|---|---|---|---|---|---|---|---|
| FMIS | Households | FMIS | Households | FMIS | Households | FMIS | Households | |
| Small | 3 | 59 | 2 | 55 | 0 | 0 | 5 | 114 |
| Medium | 0 | 0 | 2 | 63 | 1 | 38 | 3 | 101 |
| Large | 0 | 0 | 4 | 164 | 0 | 0 | 4 | 164 |
| Total | 12 | 379 | ||||||
[i] Note: River category was based on estimated lean flow (liter per second) during the last winter season: Small: <1000 lps, Medium: 1000–10,000 lps, Large: >10,000 lps.
Table 3
Critical water stress period by agro-ecological zones.
| Agro-ecological zones | Critical water stress period | Sensitive growth periods for water stress |
|---|---|---|
| Mountain/Trans-Himalaya | Feb. & March | Ear formation and early flowing for barley |
| May & mid-June | Ripening stage for barley | |
| Hills & Terai | March | Plantation & flowering for maize, winter paddy plantation |
| April | Winter paddy tillering | |
| Mid-June | Paddy field preparation & plantation |

Figure 3
Schematic diagram of crop irrigation use, river discharge and critical water stress period for: (a) Trans-Himalaya/Mountain, and (b) Hills and Terai farmer-managed irrigation systems (Source: Author).

Figure 4
Count of FMIS by river size and water stress level.
Table 4
Typology of strategies to manage water stress.
| Category | Categories | Institutional strategies | Agro-ecological zone | FMIS Cases |
|---|---|---|---|---|
| Structural | Expand water sources | Lift irrigation to augment water supply | Hill | 6, 12 |
| Reservoir to store additional water | Mountain, Hill | 1, 2, 3, 12 | ||
| Operational | Water distribution rules | Additional water distribution rules during water stress period | Mountain, Hill, Terai | 1, 2, 3, 8 |
| Water sharing mechanisms | Informal borrowing and exchange of water with neighboring FMIS | Terai | 11 |
[i] FMIS Cases: [1] Phallyak, Mustang; [2] Dhagarjung, Mustang; [3] Thangbe, Mustang; [6] Betegauda, Rasuwa; [8] Labdu Dhikure, Nuwakot; [11] Radhapur, Chitwan; [12] Pokharephat, Nuwakot.

Figure 5
Count of FMIS using different adaptation strategies by water stress.
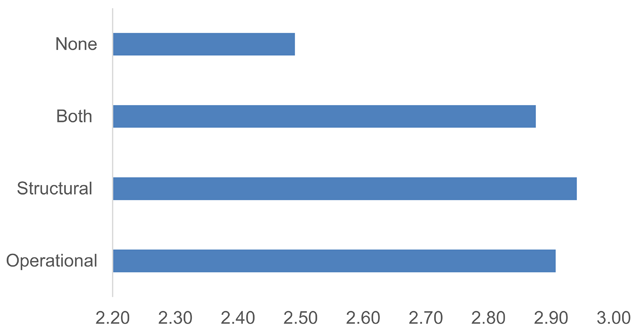
Figure 6
Average adjusted cropping intensity of FMIS adopting different adaptation strategies.
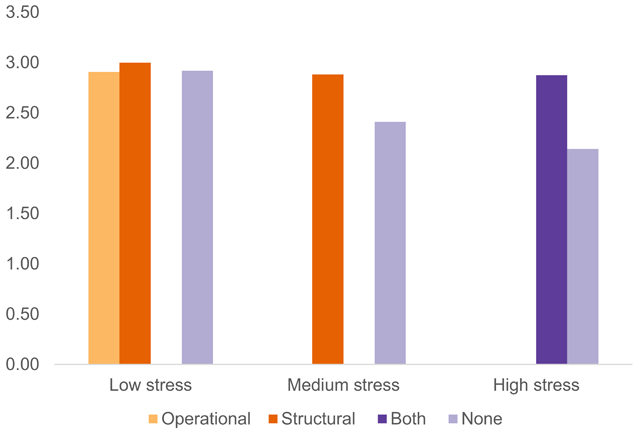
Figure 7
Cropping intensity by FMIS with different adaptation actions (operational, structural, both operational and structural and none) and water stress level.

Figure 8
Cropping intensity and governance index of FMIS with different adaptation actions (operational, structural, both operational and structural and none).