
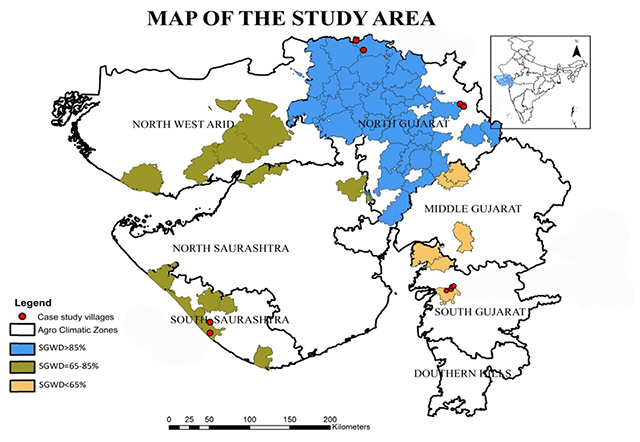
Figure 1
Map of the Study Villages.
Note: this figure not to scale and depict authentic boundaries.
Table 1
Descriptive Statistics of the Variables used in the Analysis.
| Sl. No. | Dependent Variables | Description | Mean (SD) |
|---|---|---|---|
| 1 | ΔDWLi | ΔDepth of Water Level (in feet) | 11.47 (17.07) |
| 2 | ΔCPi | ΔColumn Pipe (in no.) | 2.09 (4.61) |
| 3 | ΔPumpi | ΔPump set HP | 2.19 (4.16) |
| Independent Variables | |||
| Adoption of MI | |||
| 4 | GIAMIi | GIA under MI (%) | 0.76 (0.23) |
| 5 | YearMIi | No. of years adopted MI | 4.41 (2.84) |
| Farm and Tubewell Characteristics | |||
| 6 | GIAMIi | Gross Irrigated Area Before MI adoption | 6.03 (4.67) |
| 7 | WRMi | Water Recharge Measures | 0.60 (0.49) |
| 8 | Ln(DWater)i | Ln(Depth of water level before MI adoption) | 4.48 (0.89) |
| 9 | AgeTubewelli | Age of the Tubewell | 18.09 (9.87) |
| Water Regulatory Measures | |||
| 10 | Meteri | Meter Connection (Yes/No) | 0.35 (0.48) |
| 11 | (GIAMI*Meter)i | Gross Irrigated Area under MI*Meter Connection | 2.31 (4.54) |
| Tubewell Owners’ Characteristics | |||
| 12 | EduOwneri | Years of schooling of Tubewell Owner | 7.13 (4.87) |
| 13 | AgeOwneri | Tubewell Owners’ Age | 51.47 (12.34) |
| 14 | N | 430 |
[i] Note: SD - Standard Deviation.
Source: Authors’ Computation.
Table 2
Tubewell Owners’ Behaviour after adopting MI (Percentage of respondent).
| Sl. No. | Post Adoption Behaviour | Mean (SD) |
|---|---|---|
| 1 | Increase Gross Irrigated Area (GIA) | 0.26 (0.44) |
| 2 | Increase frequency of Irrigation | 0.80 (0.40) |
| 3 | Increase Cropping Intensity | 0.32 (0.47) |
| 4 | Shifting Water Intensive Crops | 0.37 (0.48) |
[i] Note: SD - standard deviation.
Source: Authors’ table based on the field survey.
Table 3
Impact of MI adoption on Groundwater Extraction at common aquifer level.
| Sl. No. | Independent Variables | ΔDWLi | ΔCPi | ΔPumpi |
|---|---|---|---|---|
| Coef. (Robust SE) | Coef. (Robust SE) | Coef. (Robust SE) | ||
| (i) | (ii) | (iii) | (iv) | (v) |
| Adoption of MI | ||||
| 1 | GIAMIi | –5.08 | –0.42 | 0.59 |
| (3.43) | (0.91) | (0.81) | ||
| 2 | YearMIi | 0.38 | 0.13** | 0.05 |
| (0.24) | (0.06) | (0.05) | ||
| Farm and Tubewell Characteristics | ||||
| 3 | GIABMIi | 0.37** | 0.09* | 0.03 |
| (0.18) | (0.05) | (0.04) | ||
| 4 | WRMi | 1.19 | 0.44 | 0.04 |
| (1.81) | (0.51) | (0.46) | ||
| 5 | Ln(DWater)i | 0.23 | 0.97** | 0.27 |
| (1.68) | (0.41) | (0.30) | ||
| 6 | AgeTubewelli | –0.03 | 0.01 | 0.01 |
| (0.07) | (0.02) | (0.01) | ||
| Water Regulatory Measures | ||||
| 7 | Meteri | –0.08 | 0.41 | –0.44 |
| (1.96) | (0.45) | (0.43) | ||
| 8 | (GIAMI*Meter)i | –0.49** | –0.15*** | –0.05 |
| (0.19) | (0.06) | (0.05) | ||
| Tubewell Owners’ Characteristics | ||||
| 9 | EduOwneri | –0.04 | –0.00 | –0.01 |
| (0.16) | (0.04) | (0.04) | ||
| 10 | AgeOwneri | –0.02 | 0.01 | 0.02** |
| (0.06) | (0.01) | (0.01) | ||
| 11 | Constant | 27.79*** | 0.54 | 4.77*** |
| (9.86) | (2.63) | (1.73) | ||
| 12 | R2 | 0.39 | 0.46 | 0.46 |
| 13 | F (19, 410) | 17.56*** | 9.67*** | 14.92*** |
| 14 | Village Effects | Yes | Yes | Yes |
| 15 | N | 430 | 430 | 430 |
| 16 | Model | OLS | OLS | OLS |
[i] Source: Authors’ Computation.
Note: Robust standard errors are in the parentheses; *** p < 0.01, ** p < 0.05 and * p < 0.1 respectively.