
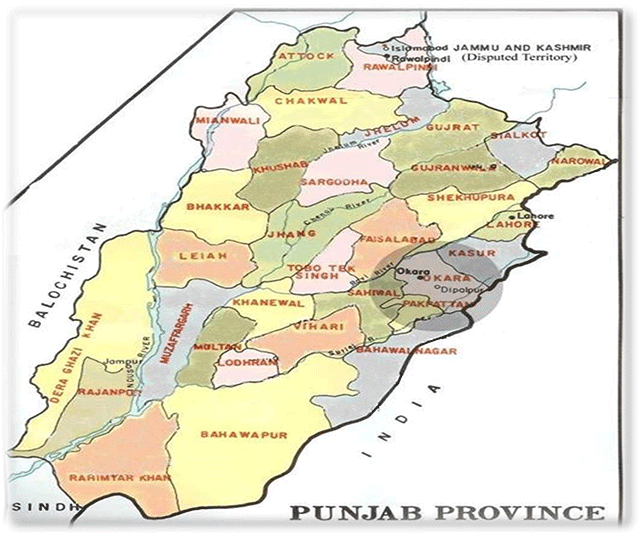
Figure 1
Map of the study area.
Table 1
Annual rainfall and temperature data for 2002–2016.
| Year | Maximum Temperature (°C) | Rainfall (mm) |
|---|---|---|
| 2002 | 30 | 931 |
| 2003 | 29 | 1247 |
| 2004 | 30 | 1027 |
| 2005 | 28 | 973 |
| 2006 | 29 | 1598 |
| 2007 | 29 | 1828 |
| 2008 | 29 | 1388 |
| 2009 | 30 | 607 |
| 2010 | 30 | 1018 |
| 2011 | 29 | 1018 |
| 2012 | 29 | 1023 |
| 2013 | 31 | 925 |
| 2014 | 28 | 1507 |
| 2015 | 28 | 1621 |
| 2016 | 30 | 1044 |
[i] Source: Govt of Punjab (2016).
Table 2
Land utilization statistics of Chakwal district (thousand hectares).
| Particulars | Rawalpindi division | Chakwal district |
|---|---|---|
| Cultivated area | 991 | 319 |
| Total cropped area | 839 | 260 |
| Unirrigated/rain-fed area | 778 | 259 |
| Kharif area | 311 | 102 |
| Rabi area | 528 | 158 |
| Wheat area | 484 | 130 |
[i] Source: Govt of Punjab (2017).
Table 3
Socioeconomic characteristics and adaptation.
| Characteristics | Unit | Mean | Standard deviation |
|---|---|---|---|
| Socioeconomic characteristics | |||
| Age | Years | 50.55 | 11.99 |
| Education | Schooling years | 7.72 | 3.65 |
| Farming experience | Years | 21.36 | 12.93 |
| Family size | Numbers | 8.21 | 2.84 |
| Males above 15 years | Numbers | 2.28 | 1.14 |
| Females above 15 years | Numbers | 1.87 | 0.95 |
| Land area | Acres | 7.75 | 15.29 |
| Livestock | Animal units | 3.02 | 3.43 |
| Tractor | Yes = 1 | 0.33 | 0.47 |
| Rotavator | Yes = 1 | 0.04 | 0.18 |
| Distance from city | Km | 9.98 | 7.75 |
| Private adaptation for private benefits | |||
| Deep plowing | Yes = 1 | 0.38 | 0.48 |
| Manure application | Yes = 1 | 0.62 | 0.49 |
| Private adaptation for public benefits | |||
| Bund making | Yes = 1 | 0.54 | 0.50 |
| Income diversification | Yes = 1 | 0.73 | 0.44 |
| Crop diversification | Yes = 1 | 0.30 | 0.46 |
| Land rented out | Yes = 1 | 0.82 | 0.38 |
Table 4
Private adaptation for private benefits and determinants.
| Variables | Manure applied | Deep plowing |
|---|---|---|
| Age | 0.04* | –0.03 |
| (0.02) | (0.02) | |
| Education | –0.01 | 0.25*** |
| (0.05) | (0.06) | |
| Farming experience | –0.08*** | 0.04* |
| (0.02) | (0.02) | |
| Family size | 0.04 | 0.26*** |
| (0.08) | (0.07) | |
| Males above 15 years | –0.03 | –0.49*** |
| (0.18) | (0.19) | |
| Female above 15 years | –0.22 | –0.35 |
| (0.23) | (0.22) | |
| Owned land area | –0.02 | 0.00 |
| (0.02) | (0.01) | |
| Livestock heads | 0.23*** | –0.03 |
| (0.07) | (0.05) | |
| Tractor ownership | 2.03*** | 0.94** |
| (0.45) | (0.37) | |
| Rotavator ownership | 0.85 | |
| (1.17) | ||
| Distance from city | –0.05** | –0.04 |
| (0.02) | (0.02) | |
| Constant | –0.12 | –2.10* |
| (1.15) | (1.19) | |
| LR Chi2 | 62.67*** | 47.81*** |
| Observations | 198 | 191 |
[i] Standard errors in parentheses.
*** p < 0.01, ** p < 0.05, * p < 0.1.
Table 5
Determinants of Private adaptation for public benefits.
| Variables | Bund-making | Income diversification | Crop diversification | Land renting out |
|---|---|---|---|---|
| Age | 0.02 | 0.06** | 0.04 | –0.02 |
| (0.02) | (0.03) | (0.03) | (0.03) | |
| Education | 0.29*** | 0.13 | 0.15* | –0.08 |
| (0.06) | (0.08) | (0.08) | (0.08) | |
| Farming experience | 0.05** | –0.05* | 0.02 | 0.00 |
| (0.02) | (0.03) | (0.03) | (0.03) | |
| Family size | 0.39*** | –0.04 | 0.16* | –0.07 |
| (0.09) | (0.11) | (0.09) | (0.09) | |
| Males above 15 years | 0.33 | 0.27 | 0.73** | 0.54* |
| (0.20) | (0.25) | (0.28) | (0.31) | |
| Female above 15 years | –0.13 | 0.28 | 0.56* | 0.52 |
| (0.24) | (0.32) | (0.31) | (0.35) | |
| Owned land area | 0.09** | –0.00 | 0.00 | –0.34*** |
| (0.04) | (0.06) | (0.02) | (0.07) | |
| Livestock heads | 0.04 | 1.82*** | –0.04 | 0.13 |
| (0.06) | (0.30) | (0.08) | (0.08) | |
| Tractor ownership | 0.68 | –1.01 | 4.98*** | –1.18** |
| (0.42) | (0.65) | (0.70) | (0.58) | |
| Rotavator ownership | –1.27 | –0.90 | –1.67 | 0.17 |
| (1.07) | (1.18) | (1.56) | (1.46) | |
| Distance from city | –0.01 | 0.00 | 0.06* | 0.01 |
| (0.02) | (0.04) | (0.03) | (0.03) | |
| Constant | –8.68*** | –4.79*** | –8.74*** | 4.59*** |
| (1.59) | (1.68) | (2.14) | (1.71) | |
| LR chi2 | 84.65*** | 123.69*** | 136.34*** | 82.93*** |
| Observations | 198 | 198 | 198 | 198 |
[i] Standard errors in parentheses.
*** p < 0.01, ** p < 0.05, * p < 0.1.
Table 6
Estimates of adaptation practices on wheat yield.
| Variables | Coefficients | Standard error |
|---|---|---|
| Constant | 7.00 | 0.22 |
| Age | 0.01 | 0.00 |
| Farming experience | –0.01 | 0.00 |
| Family size | –0.05** | 0.02 |
| Male above 15 years | 0.06* | 0.03 |
| Female above 15 years | 0.06* | 0.04 |
| Renting out | –0.24*** | 0.09 |
| Bund making | 0.11 | 0.08 |
| Manure application | 0.04 | 0.08 |
| Deep ploughing | 0.07* | 0.04 |
| Crop diversification | 0.25*** | 0.08 |
| Income diversification | –0.08* | 0.04 |
| R2 | 0.15 | |
| Adjusted R2 | 0.13 | |
| F-test | 3.79*** | |
| Observations | 198 |
[i] *** p < 0.01, ** p < 0.05, * p < 0.1.