
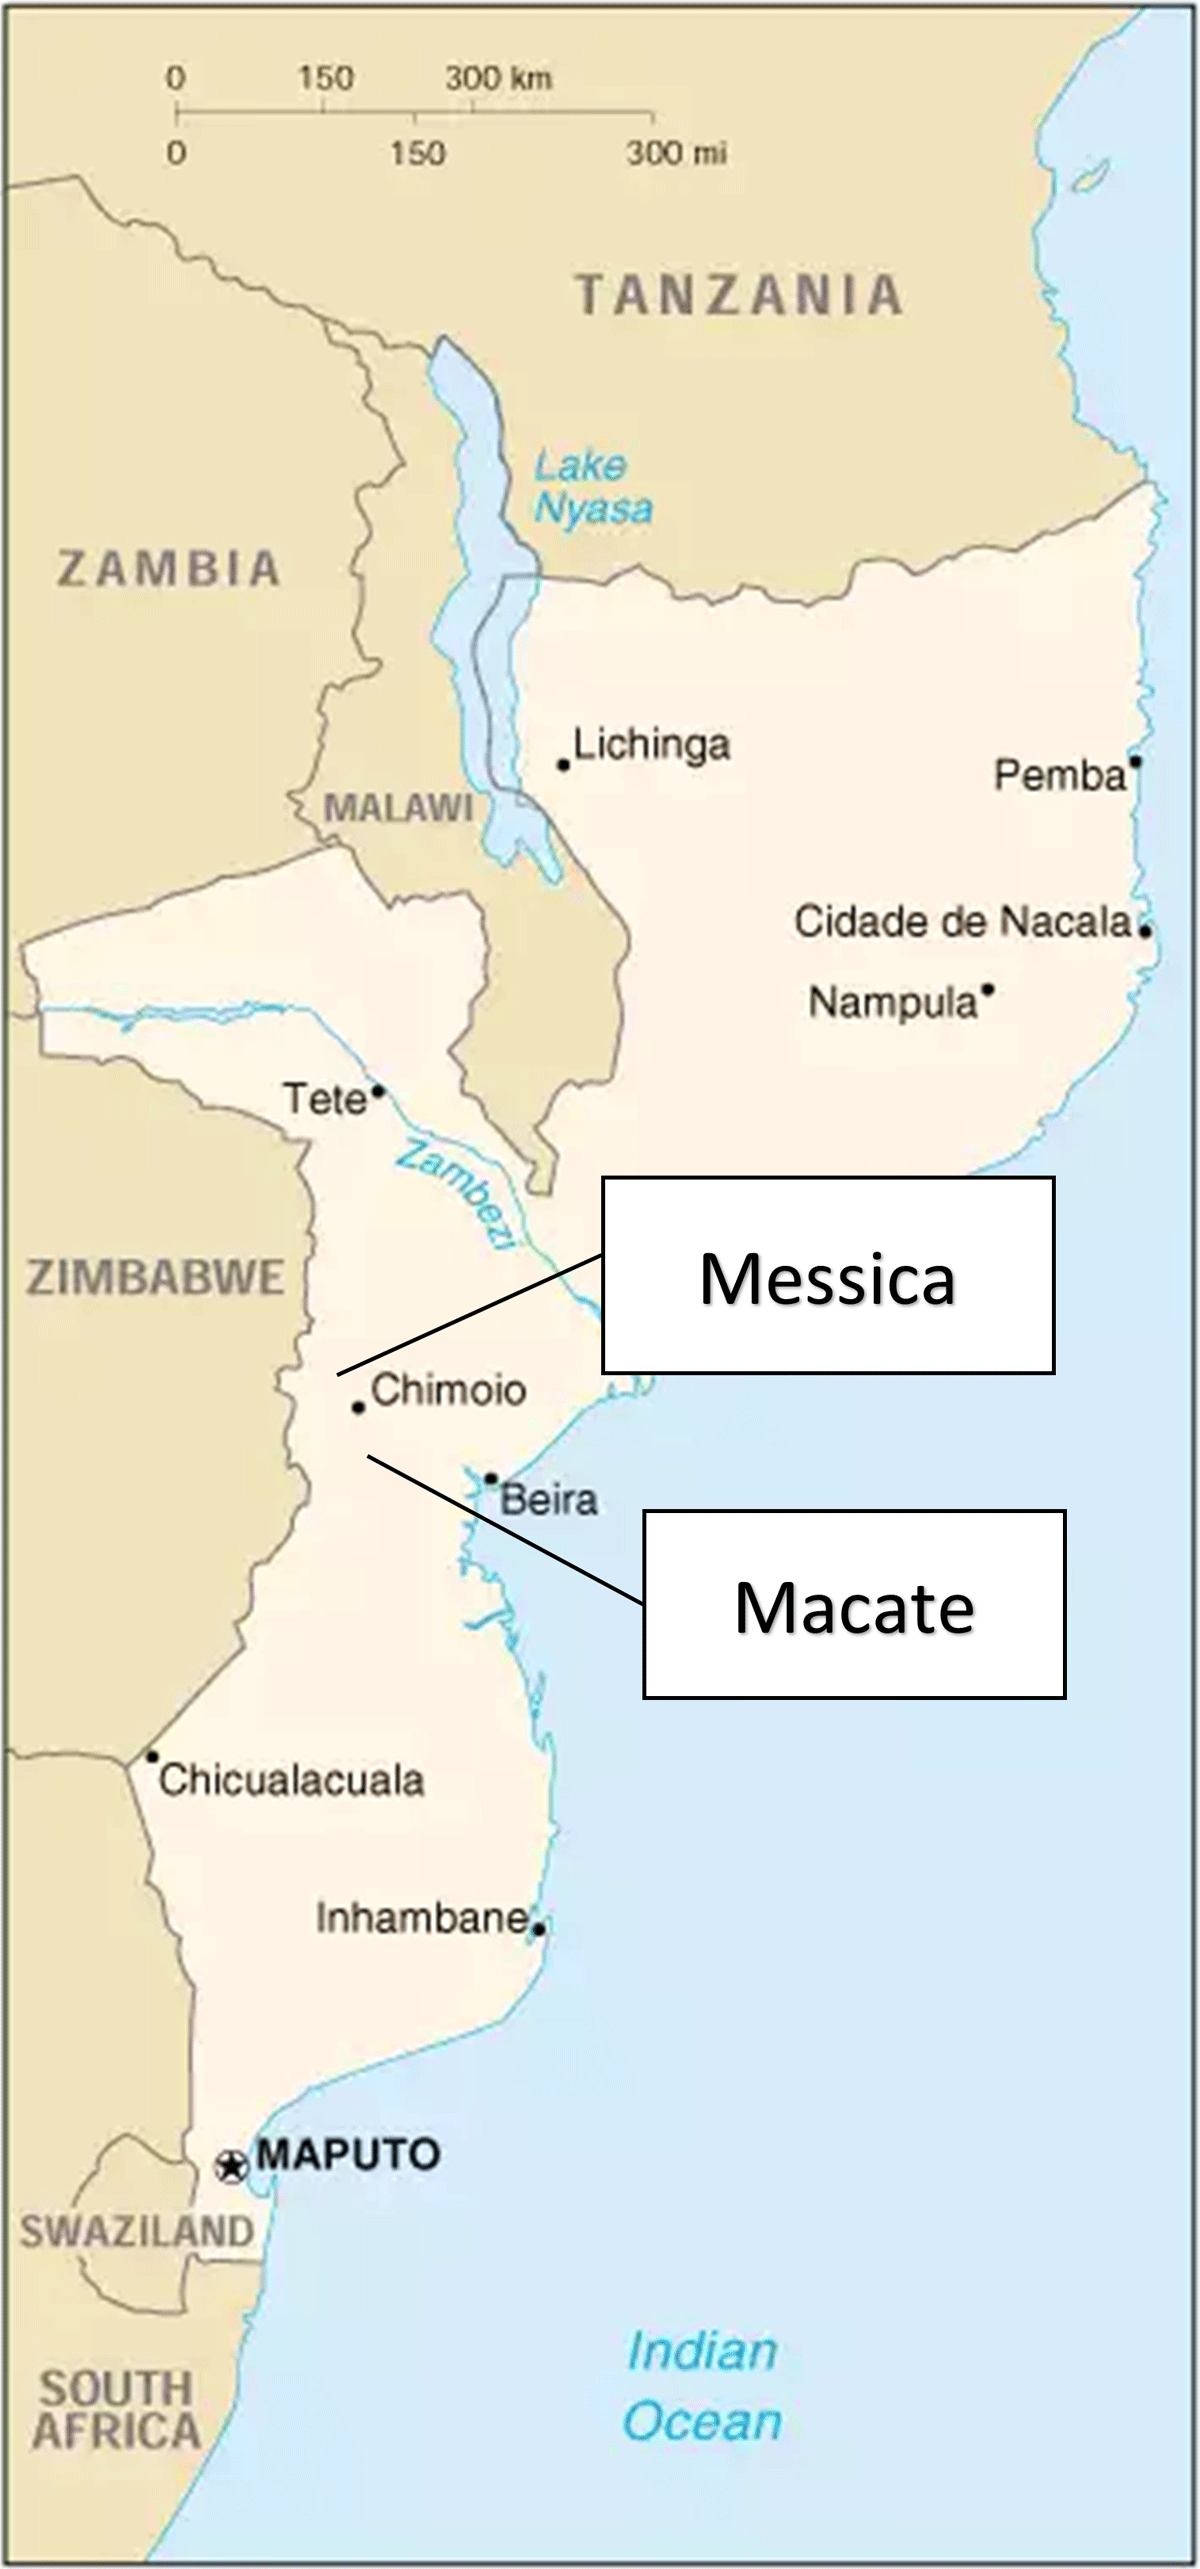
Figure 1
Location of research areas in Mozambique.
Source: https://www.globecountries.com/country/mozambique.html (visited 20 June 2022)
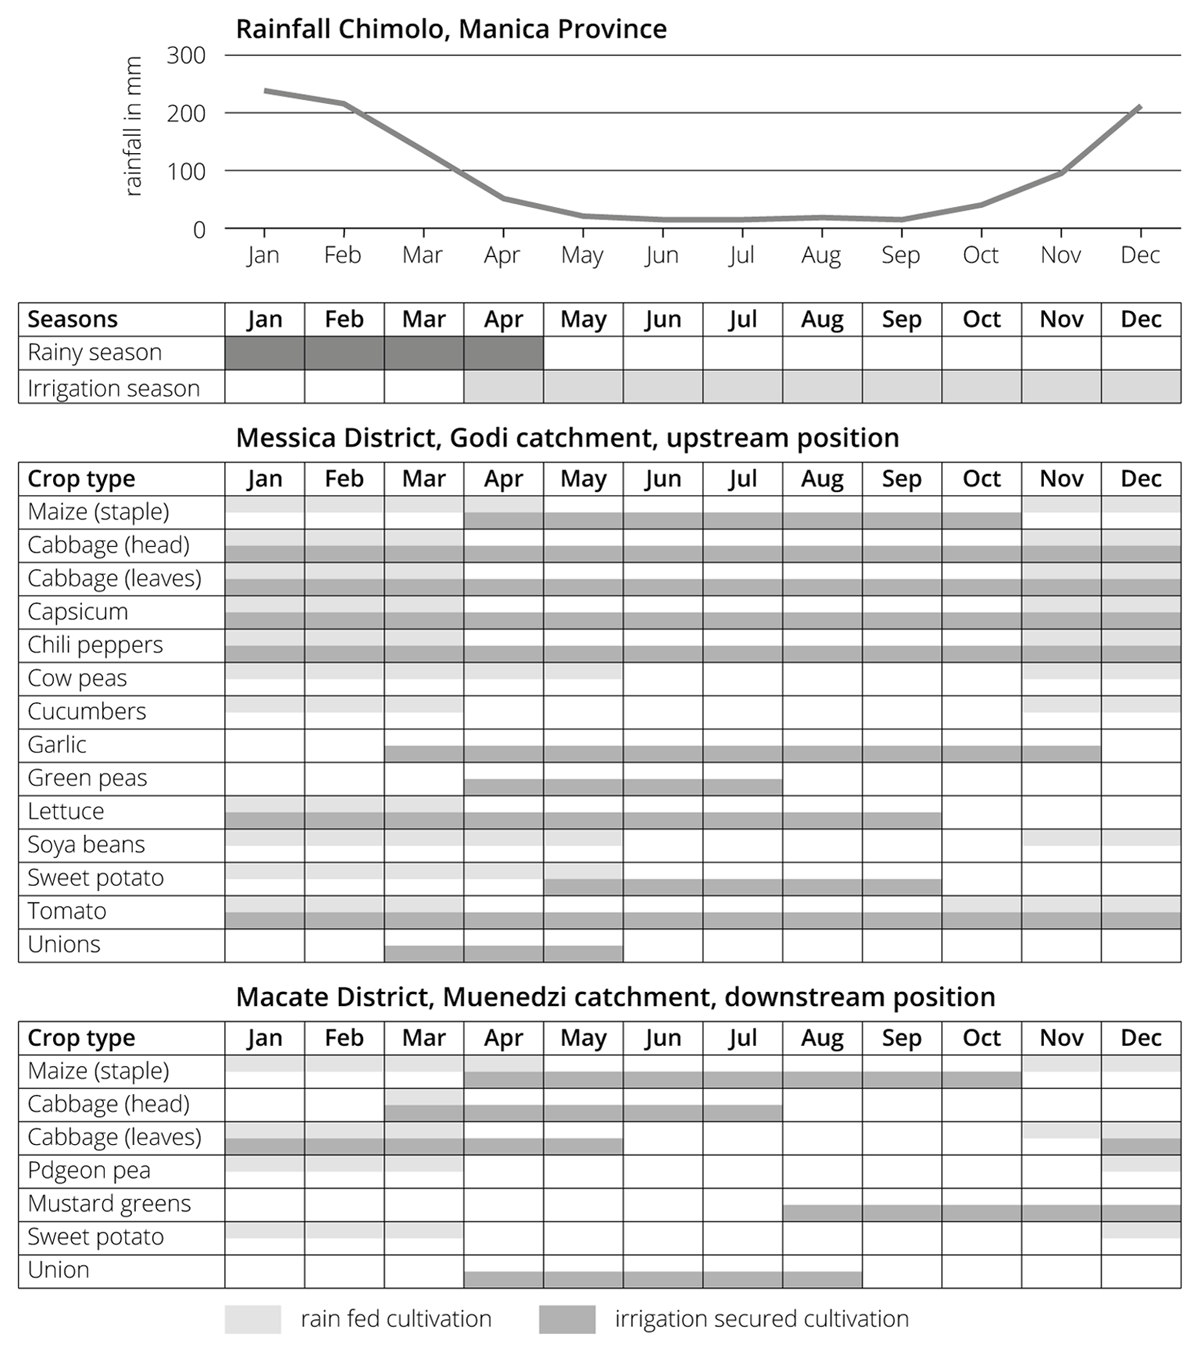
Figure 2
Examples of cropping calendars in the research areas.
Source: Compilation based on field work; see INAM (2017) for rainfall data.
Table 1
Characteristics of farmer-led irrigation development.
| RESEARCH AREA | MACATE | MESSICA | |
|---|---|---|---|
| Households in sample (n = 622) | 377 | 245 | |
| Average landholding (ha) | 4.43 | 5.93 | |
| Households with access to irrigation | (58% of total) 217 | (62% of total) 152 | |
| Inputs | Use of improved seeds | (36%) 78 | (39%) 59 |
| Use of fertilizer | (26%) 56 | (48%) 73 | |
| Use of pesticides | (28%) 61 | (42%) 64 | |
| Hiring farm labourers | (57%) 124 | (42%) 64 | |
| Household income from irrigated crops | More than half | (38%) 82 | (61%) 92 |
| About half | (33%) 72 | (24%) 36 | |
| Less than half | (29%) 63 | (16%) 24 | |
| Other income | Labouring for others | (32%) 69 | (34%) 52 |
| Average indicators | Asset index | 15.6 | 25.3 |
| Livestock index | 0.2 | 0.7 | |
| House quality index | 5.2 | 5.8 | |
| Month food shortage | 2.0 | 2.0 | |
| Households without access to irrigation | (42% of total) 160 | (38% of total) 93 | |
| Inputs | Use of improved seeds | (5%) 8 | (13%) 12 |
| Use of fertilizer | (0%) 0 | (1%) 1 | |
| Use of pesticides | (1%) 2 | (1%) 1 | |
| Hiring farm employees | (24%) 38 | (23%) 21 | |
| Income | Labouring for others | (39%) 62 | (49%) 46 |
| Average indicators | Asset index | 9.4 | 14.5 |
| Livestock index | 0.1 | 0.5 | |
| House quality index | 4.6 | 5.0 | |
| Month food shortage | 2.8 | 2.8 | |
| Total irrigated fields (n = 458) | 243 | 215 | |
| Source of water | River | (68%) 166 | (99%) 212 |
| Lake | (5%) 11 | (0%) 0 | |
| Floods | (14%) 35 | (1%) 3 | |
| Well (ground water) | (13%) 31 | (0%) 0 | |
| Irrigation transport technology | Furrow | (23%) 56 | (94%) 203 |
| Bucket | (62%) 151 | (5%) 11 | |
| Pump (motor) | (12%) 30 | (0%) 1 | |
| Pump (electric) | (1%) 3 | (0%) 0 | |
| Pump (treadle) | (1%) 3 | (0%) 0 | |
[i] Source: Survey data of the DFID-ESRC-supported research project, collected in 2017.
Table 2
Characteristics of gender in farmer-led irrigation development.
| RESEARCH AREA | MACATE | MESSICA | |
|---|---|---|---|
| Households in sample(n = 622) | 377 | 245 | |
| Households with access to irrigation | (58% of total) 217 | (62% of total) 152 | |
| Female-headed household | Total number | (16%) 35 | (19%) 29 |
| Household size (persons) | 5.0 | 6.8 | |
| Total land area (ha) | 3.62 | 5.73 | |
| Irrigated land area (ha) | 1.25 | 2.14 | |
| Unirrigated land area (ha) | 2.37 | 3.59 | |
| Area cultivated per adult (ha) | 0.46 | 0.56 | |
| Male-headed household | Total number | (84%) 182 | (81%) 123 |
| Household size (persons) | 6.0 | 7.4 | |
| Total land area (ha) | 5.93 | 6.64 | |
| Irrigated land area (ha) | 2.41 | 3.35 | |
| Unirrigated land area (ha) | 3.52 | 3.29 | |
| Area cultivated per adult (ha) | 0.60 | 0.56 | |
| Households without access to irrigation | (42% of total) 160 | (38% of total) 93 | |
| Female-headed household | Total number | (29%) 46 | (9%) 8 |
| Household size (persons) | 4.6 | 4.0 | |
| Total land area (ha) | 2.14 | 2.63 | |
| Area cultivated per adult (ha) | 0.64 | 0.92 | |
| Male-headed household | Total number | (71%) 114 | (91%) 85 |
| Household size (persons) | 5.2 | 5.7 | |
| Total land area (ha) | 2.97 | 5.35 | |
| Area cultivated per adult (ha) | 0.68 | 0.94 | |
| Total irrigated fields (n = 458) | 243 | 215 | |
| Means of allocation | By tribal authority | (6%) 15 | (25%) 54 |
| Inherited | (68%) 165 | (47%) 101 | |
| Purchased | (12%) 29 | (20%) 43 | |
| Rented | (6%) 15 | (6%) 13 | |
| By irrigation association | (9%) 22 | (2%) 4 | |
| Irrigation manager | Head of the household | (56%) 136 | (48%) 103 |
| Head & spouse | (11%) 27 | (21%) 45 | |
| Spouse | (1%) 2 | (4%) 9 | |
| Head, spouse, children | (4%) 10 | (4%) 9 | |
| Head & children | (2%) 5 | (1%) 2 | |
| Children | (5%) 12 | (3%) 6 | |
| Other combinations | (8%) 19 | (19%) 41 | |
[i] Source: Survey data of the DFID-ESRC-supported research project, collected in 2017.